Cartography
Work showcasing a range of applications.
Web Map Development
This example demonstrates an interactive web map developed to visualize spatial data dynamically. It demonstrates real-time data layers, user interaction, and spatial storytelling to support analysis and decision-making.
Spatial Modelling
Air Pollution Exposure
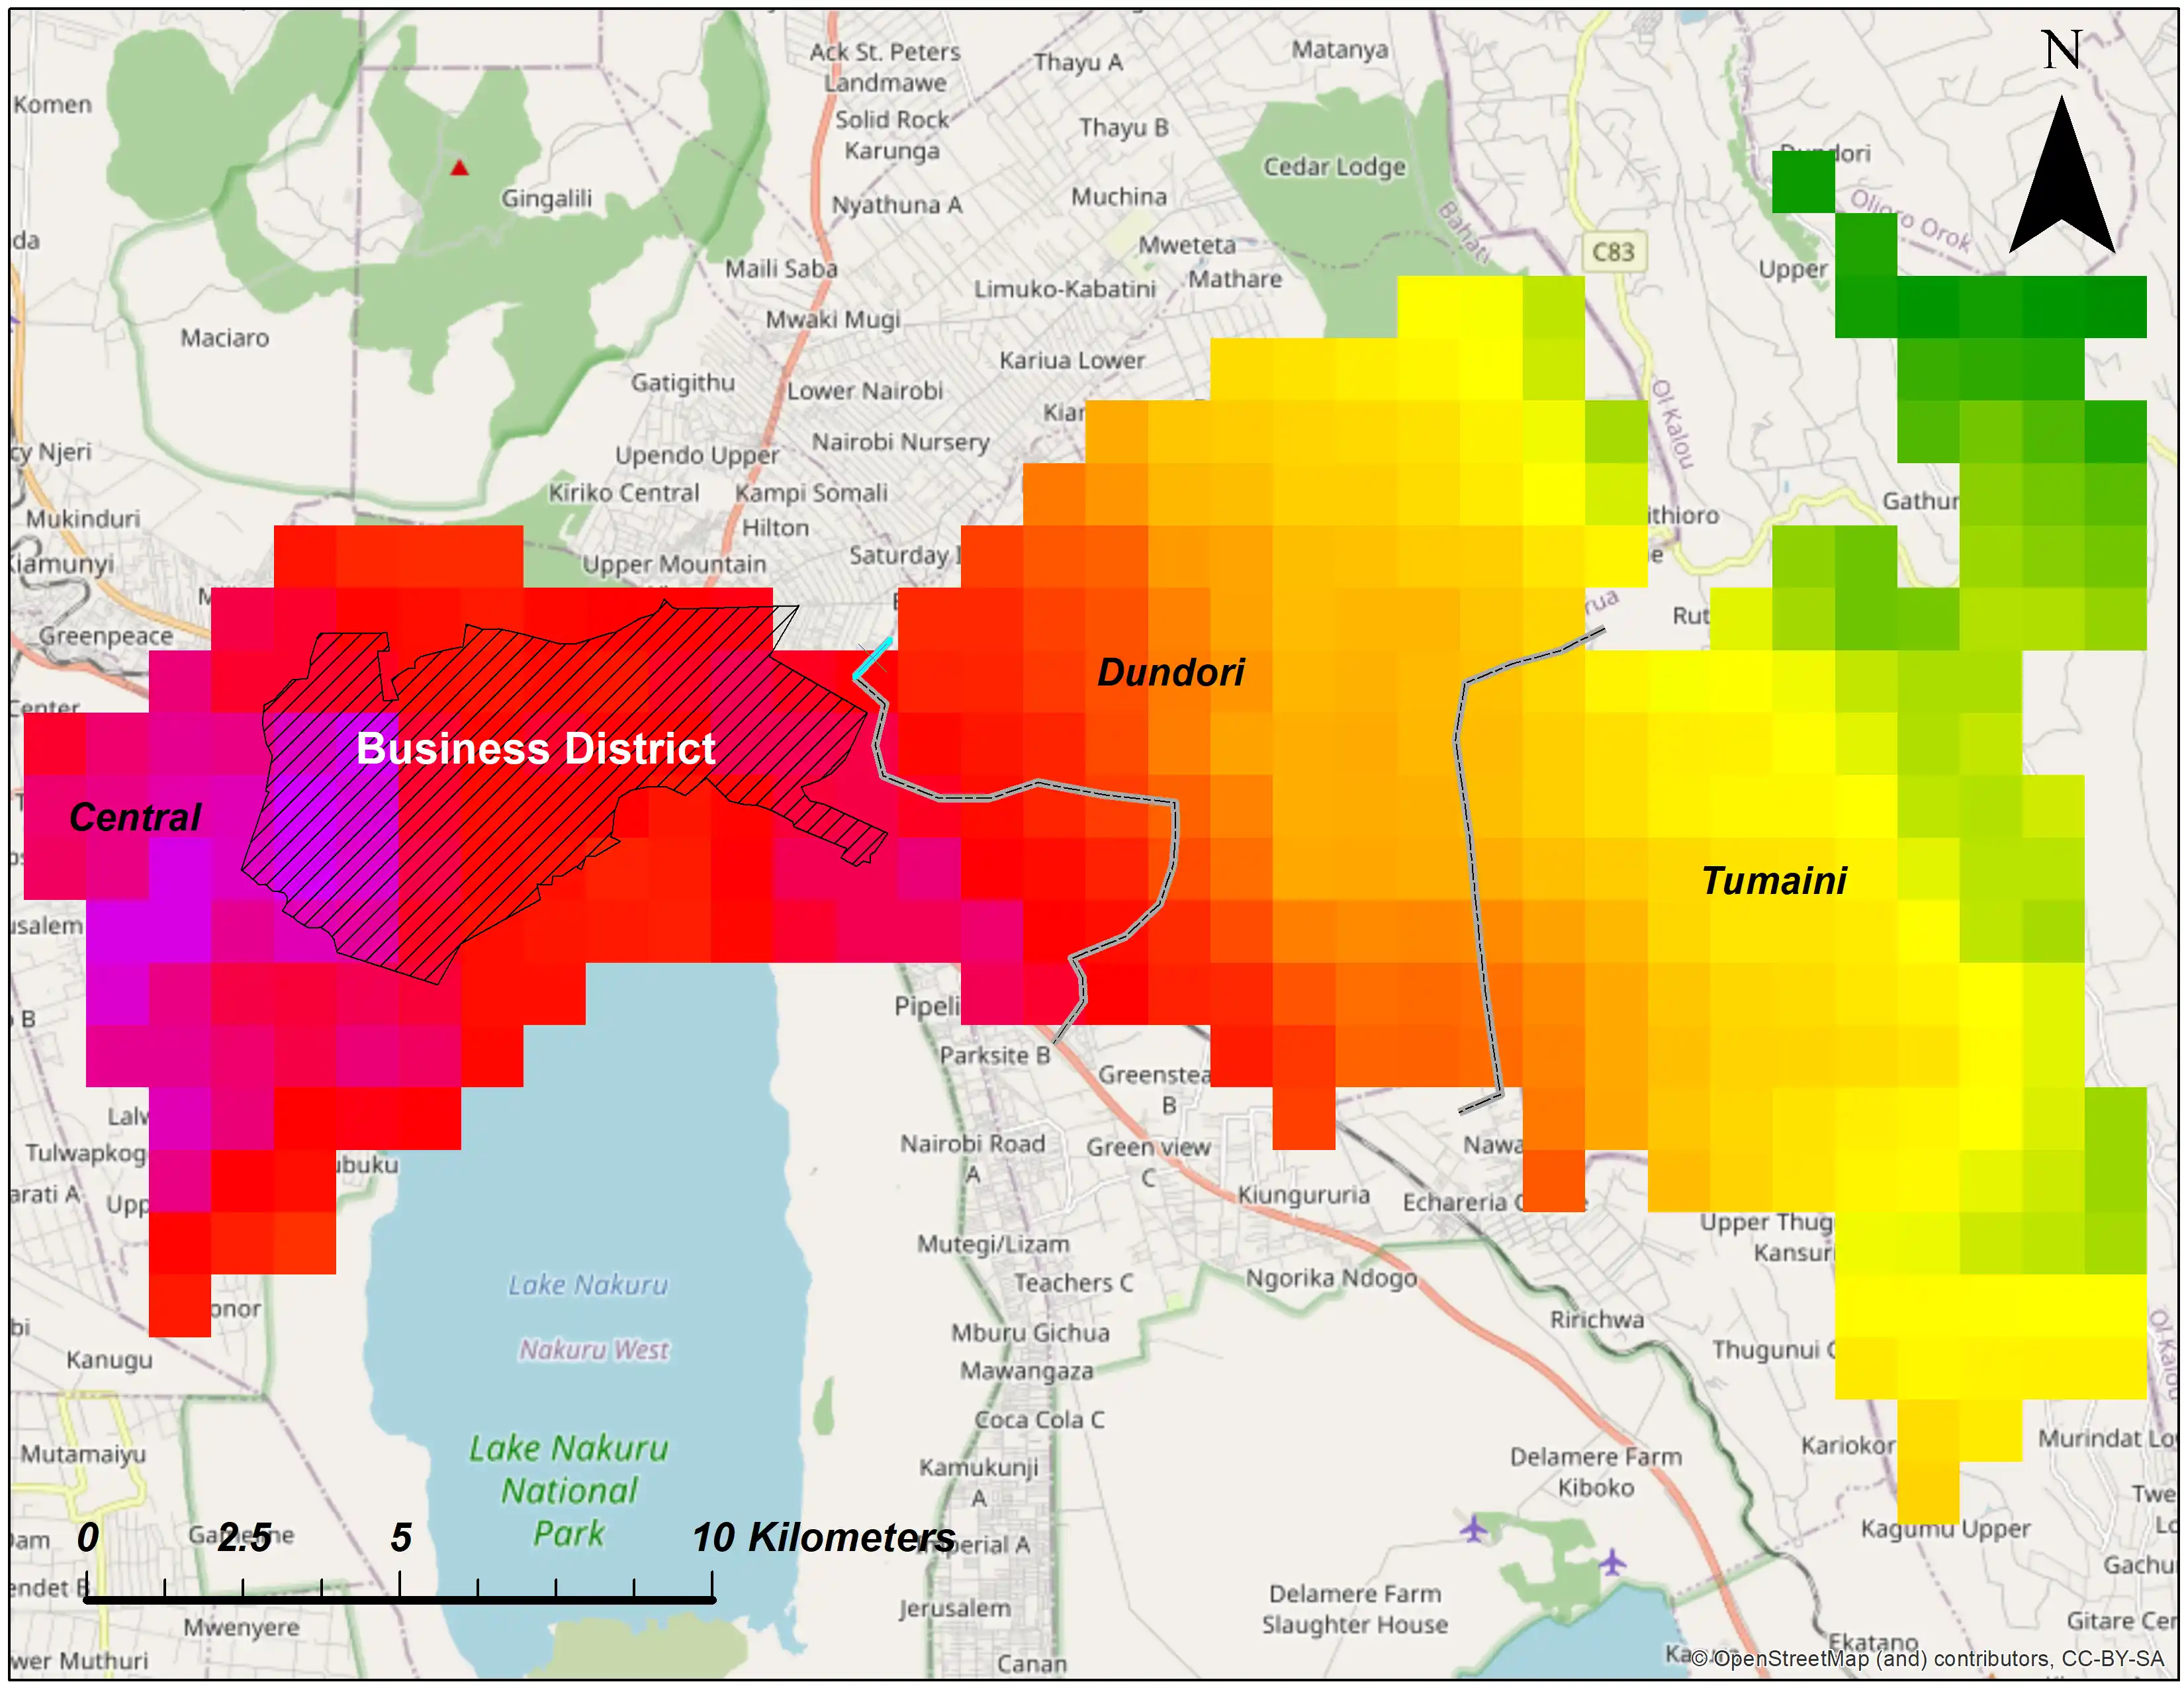
This map illustrates air pollution exposure across Central Nakuru County. The Central Nakuru CBD is highlighted in purple and red, indicating high pollutant concentrations due to dense urban activities and traffic emissions. Rural areas to the east in Nyandarua County are shown in yellow and green, reflecting lower pollution levels and cleaner air.
Spatial Distribution Analysis
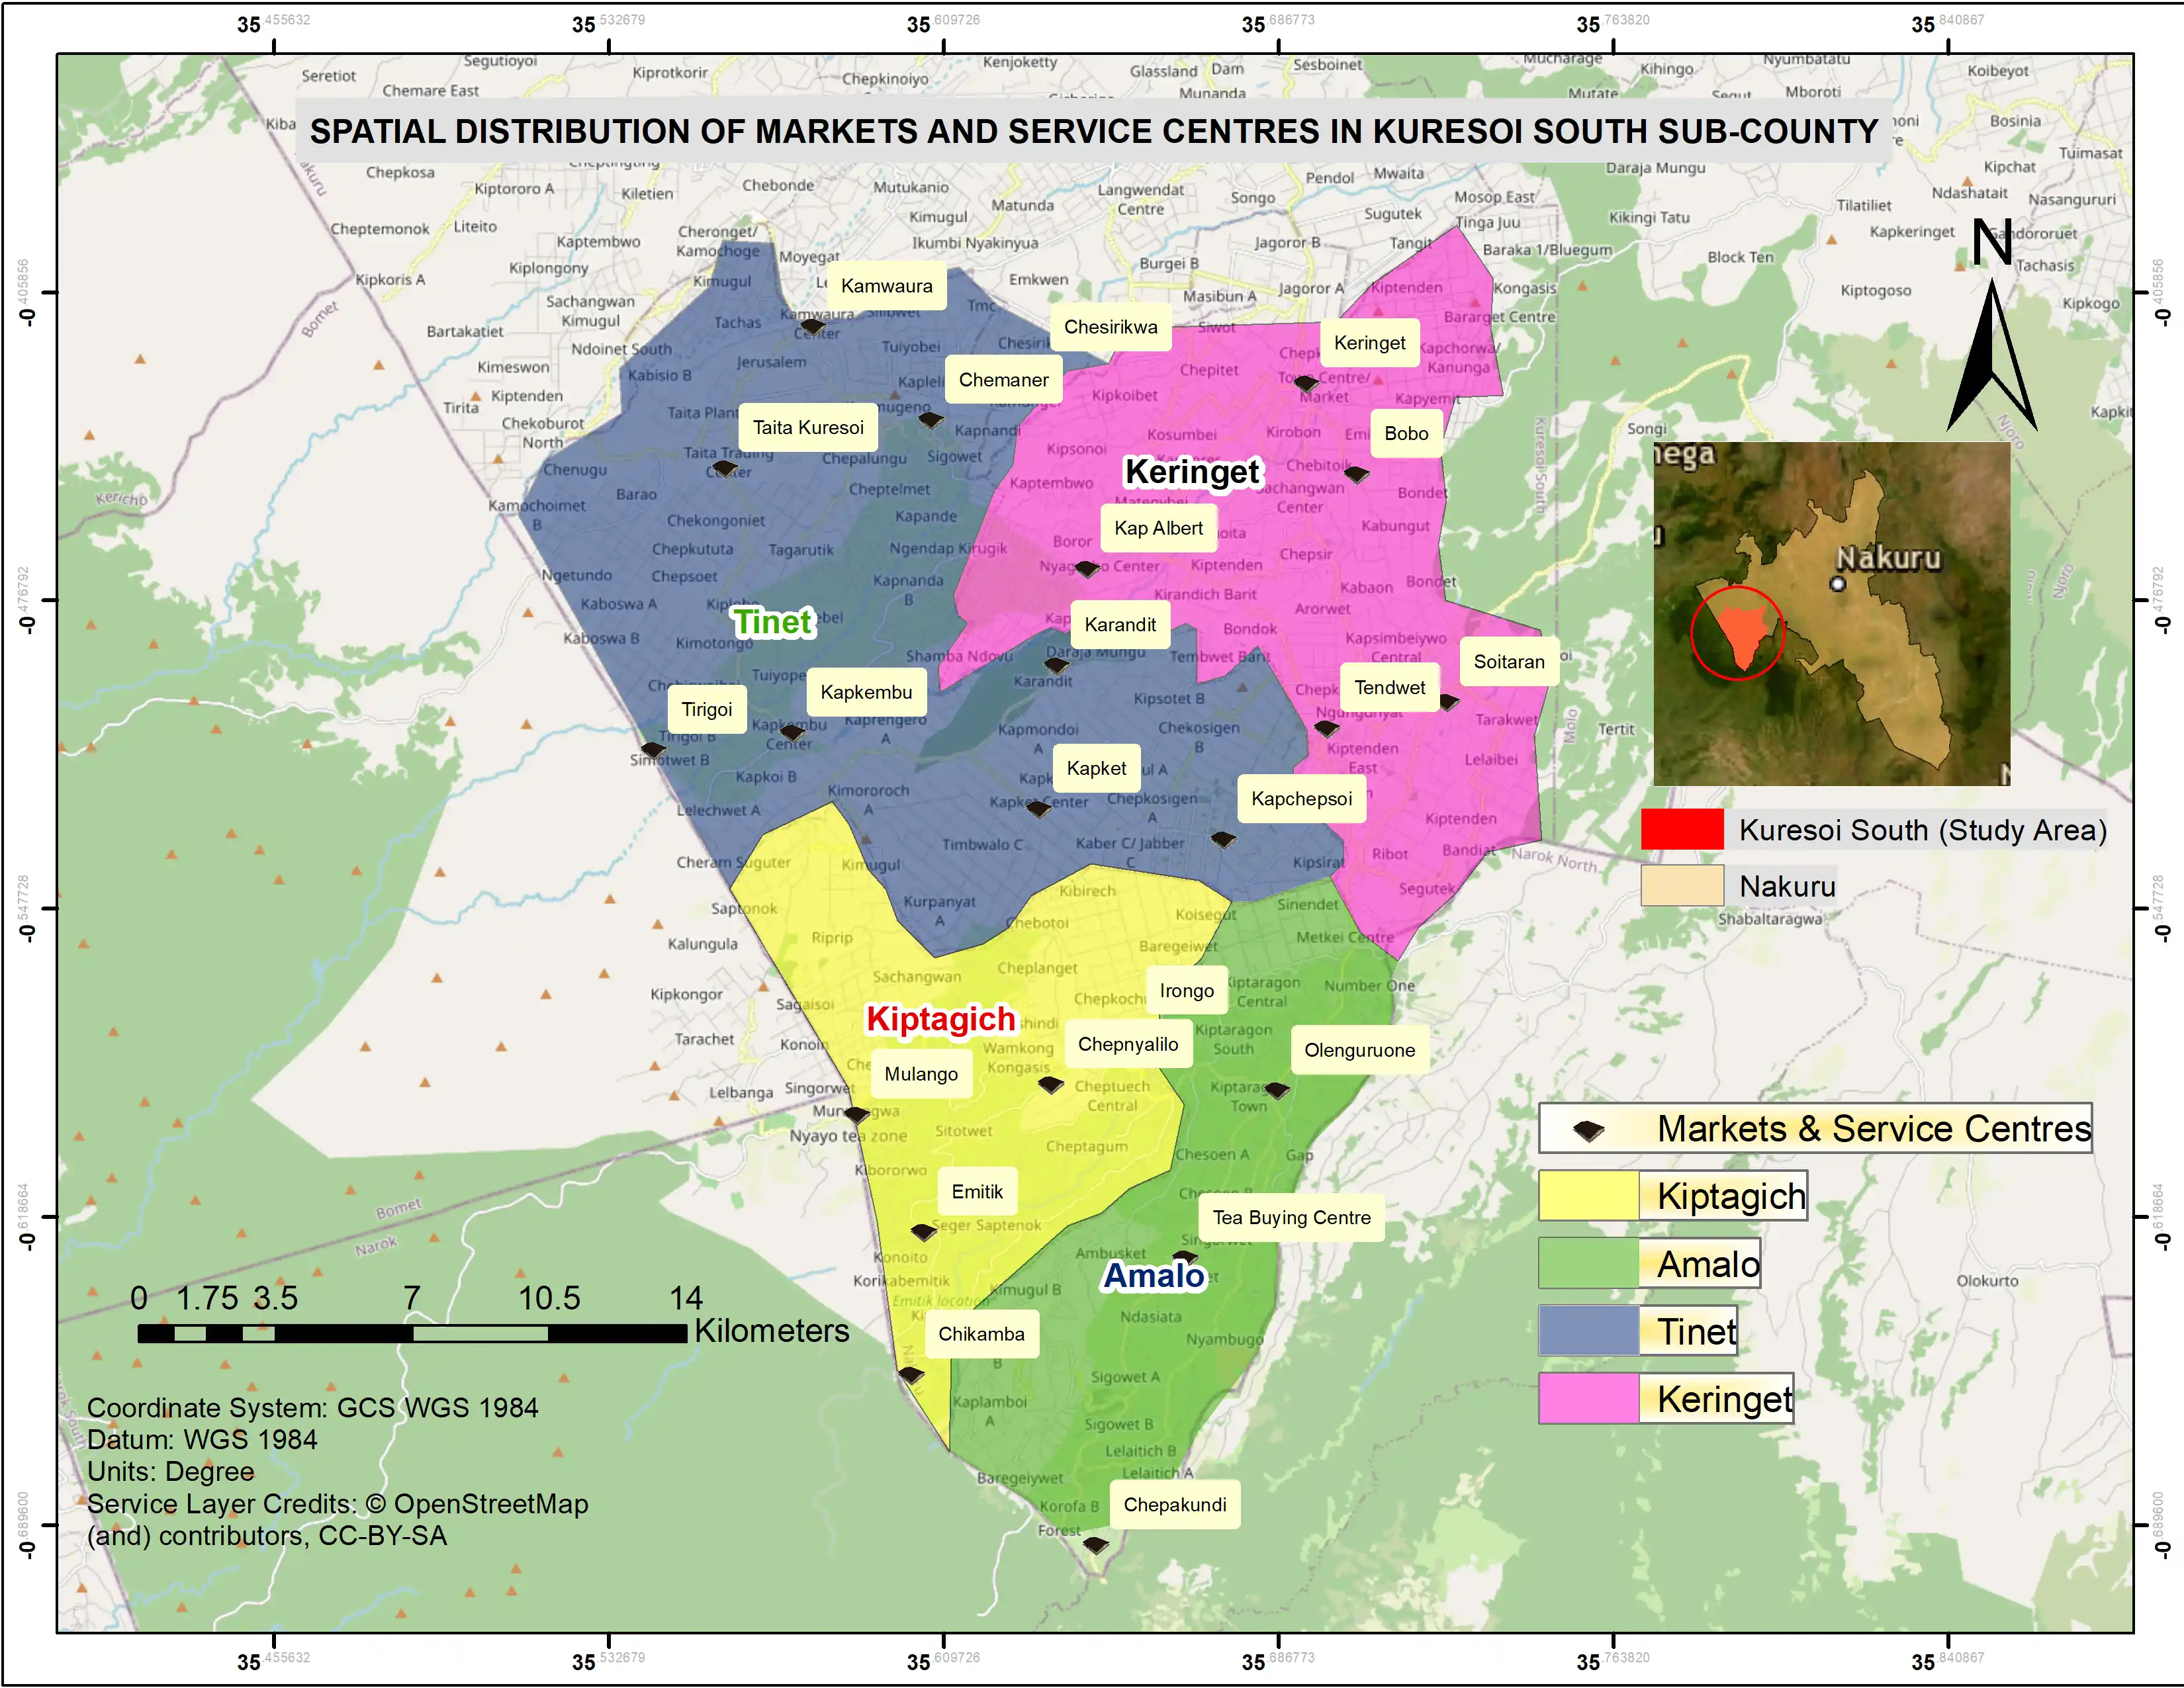
This map presents the spatial distribution of service centres within Nakuru West. The analysis highlights facility density, clustering patterns and underserved locations, helping planners assess accessibility and infrastructure allocation.
Urban Heat Island Analysis
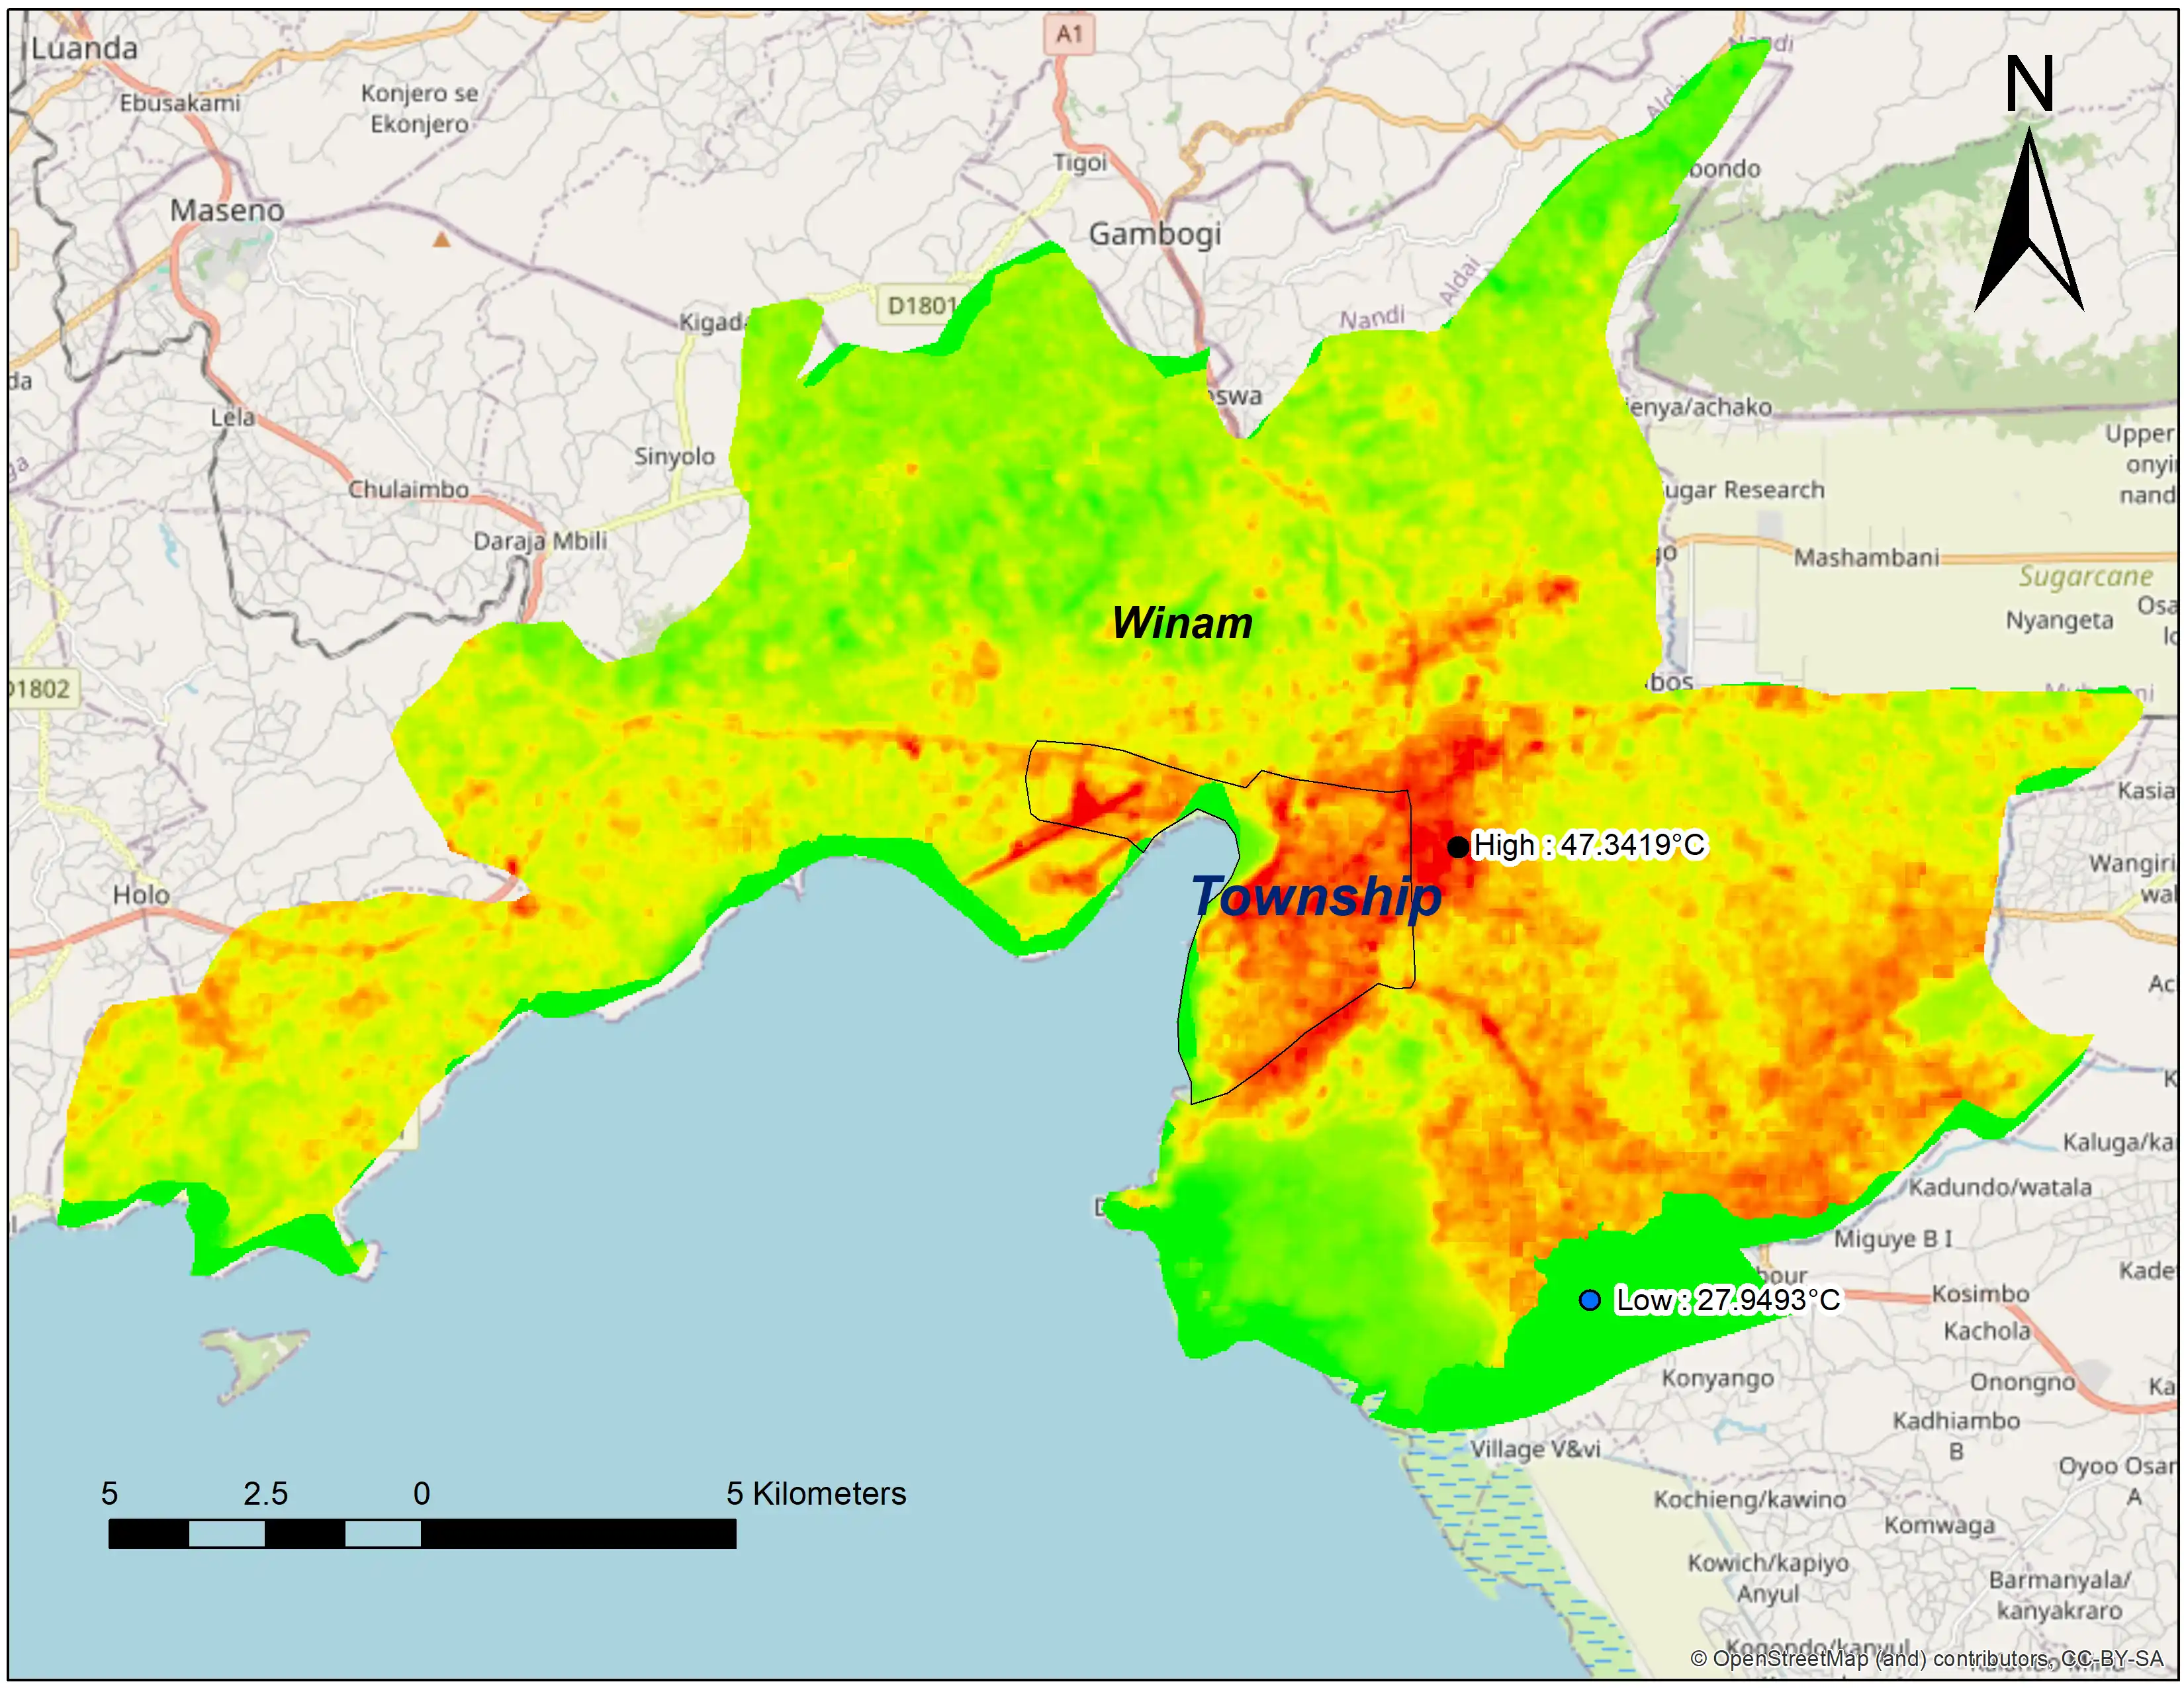
This example demonstrates urban heat intensity in Kisumu City. Red areas indicate intense heat concentrations associated with dense built-up environments while vegetated zones exhibit lower surface temperatures.
3D Spatial Modelling
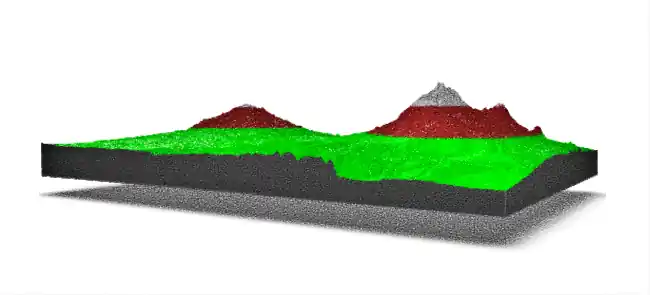
The example below presents a 3D model of Mount Kenya. Interactive 3D modelling enhances understanding of terrain, elevation and spatial relationships.
Remote Sensing
LiDAR Analysis
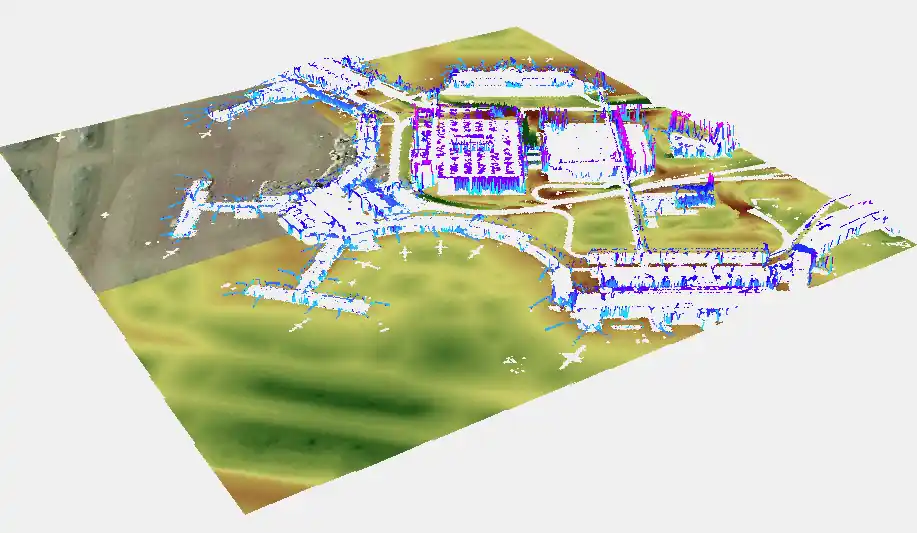
This is an example of LiDAR data used to capture highly detailed 3D information about terrain, buildings, and vegetation. The resulting data supports accurate elevation modelling and environmental analysis.
Land Cover Change Detection
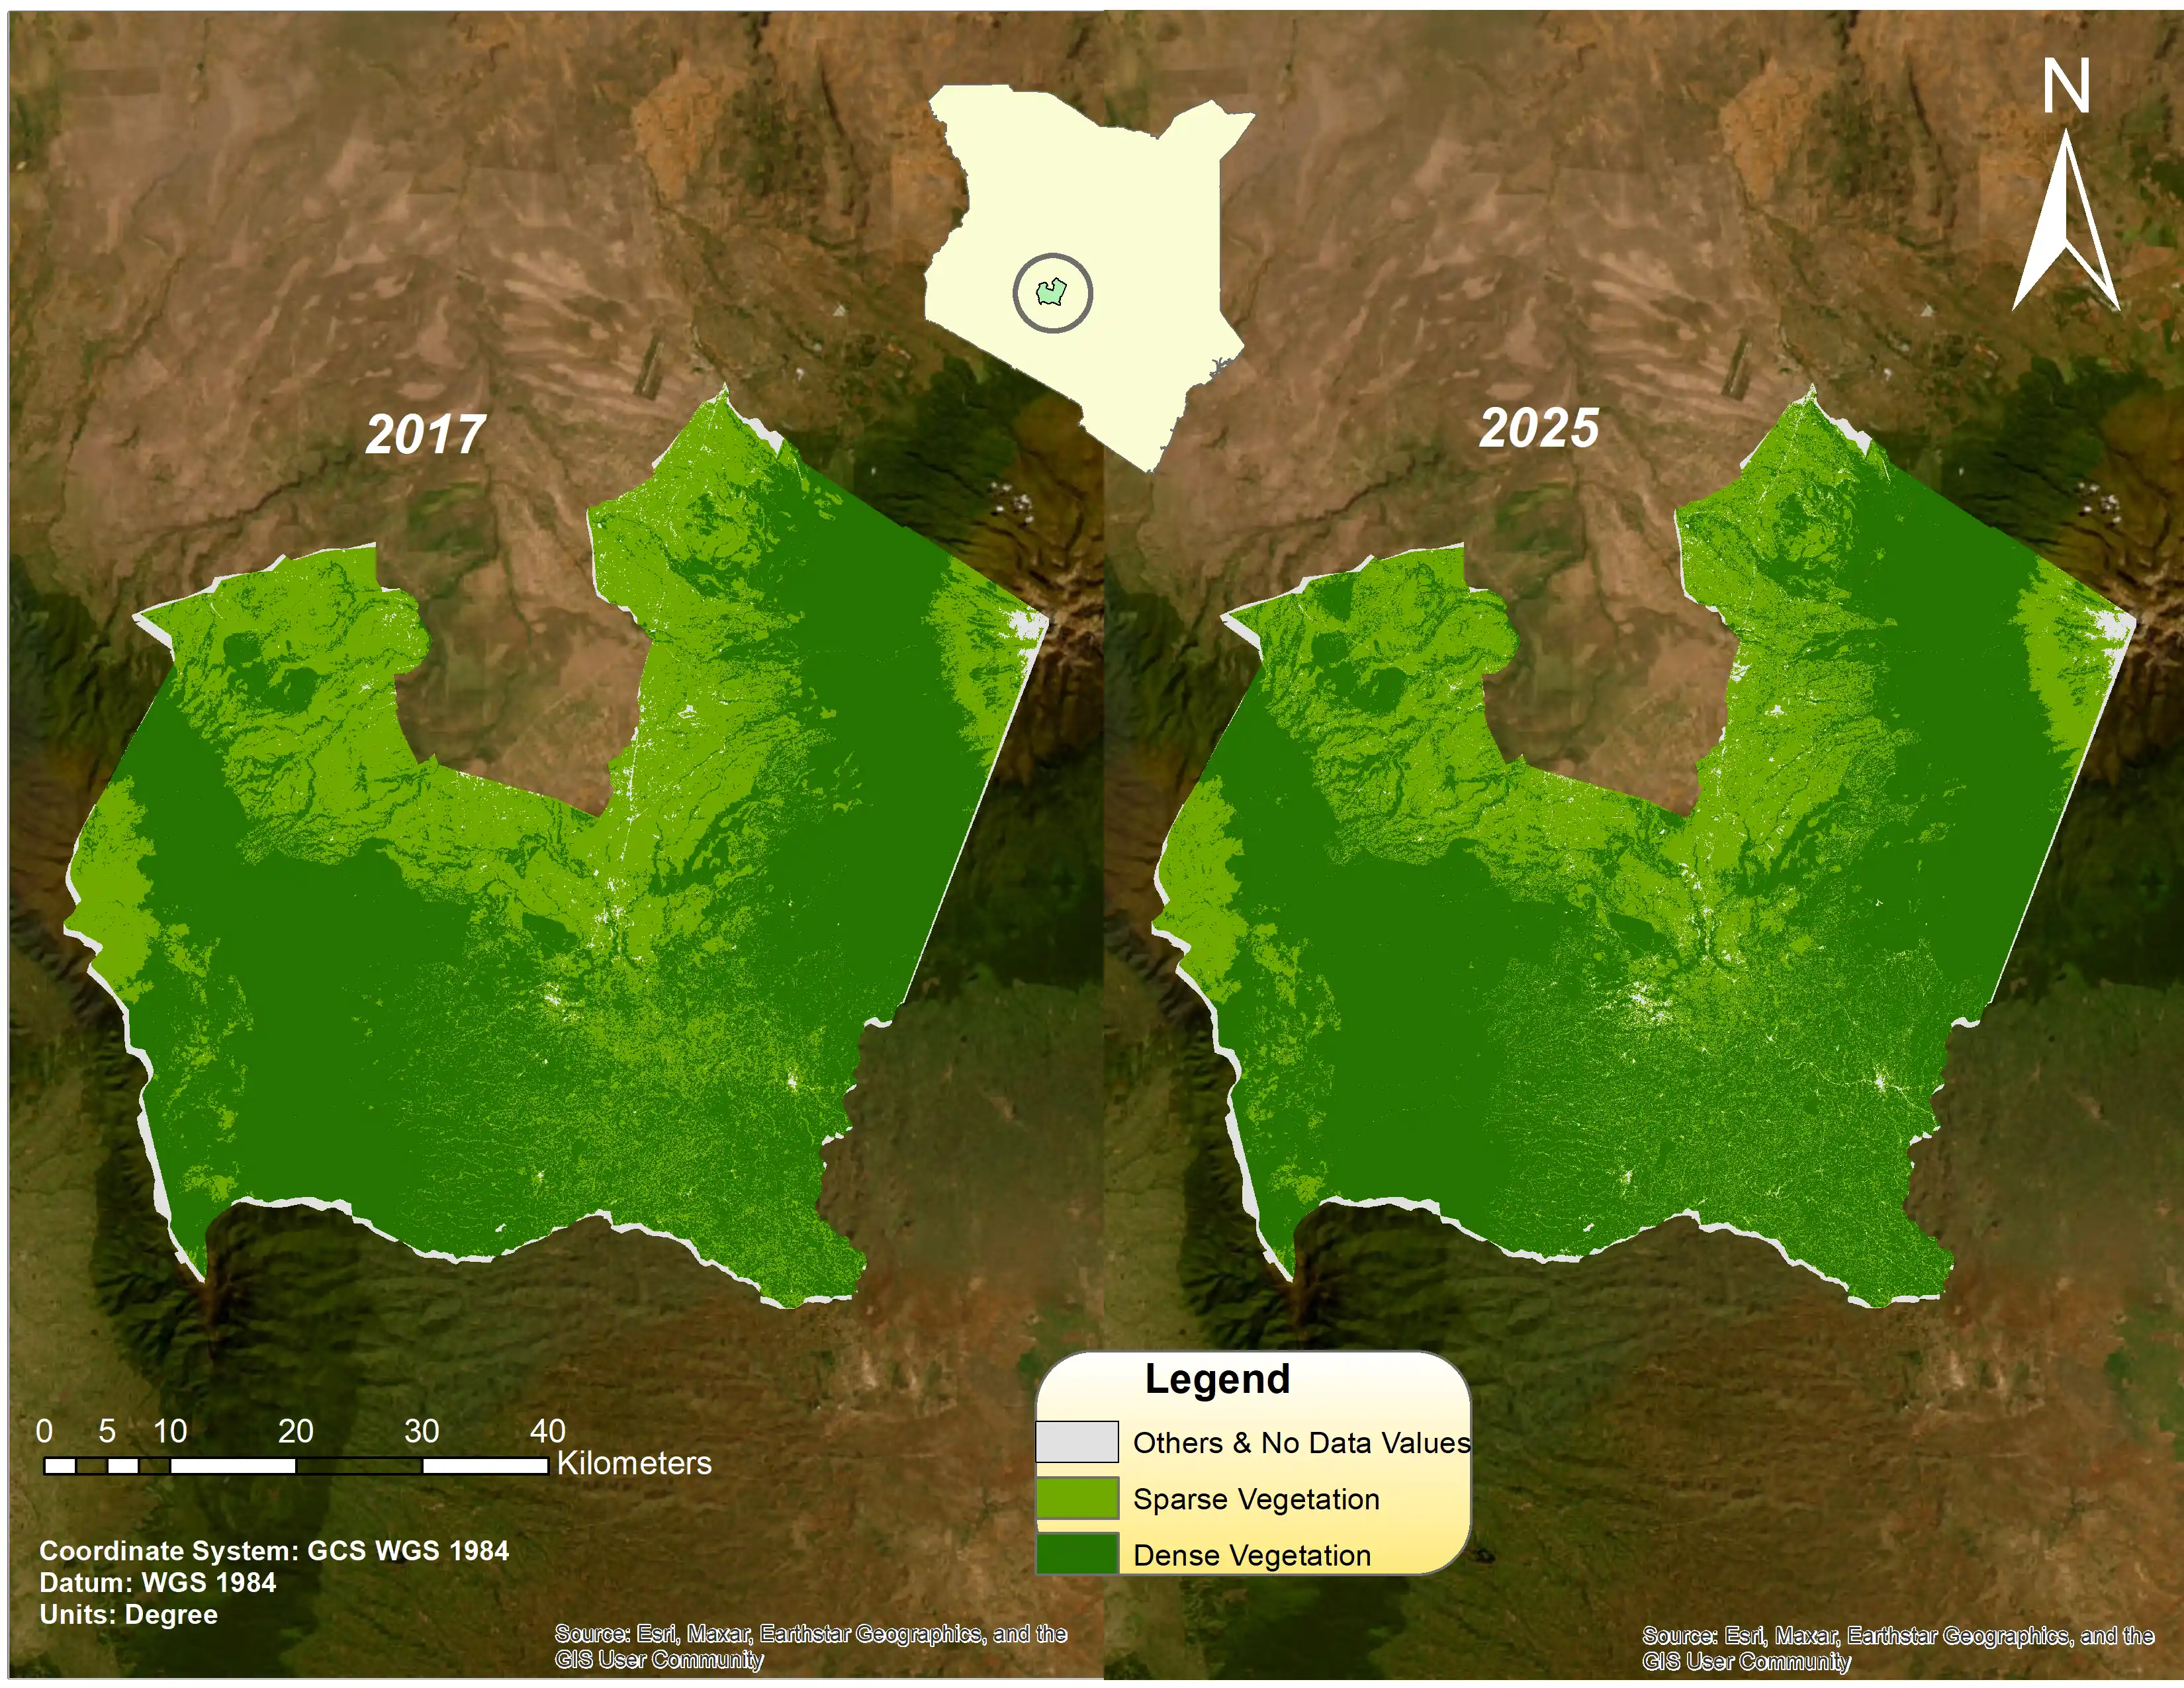
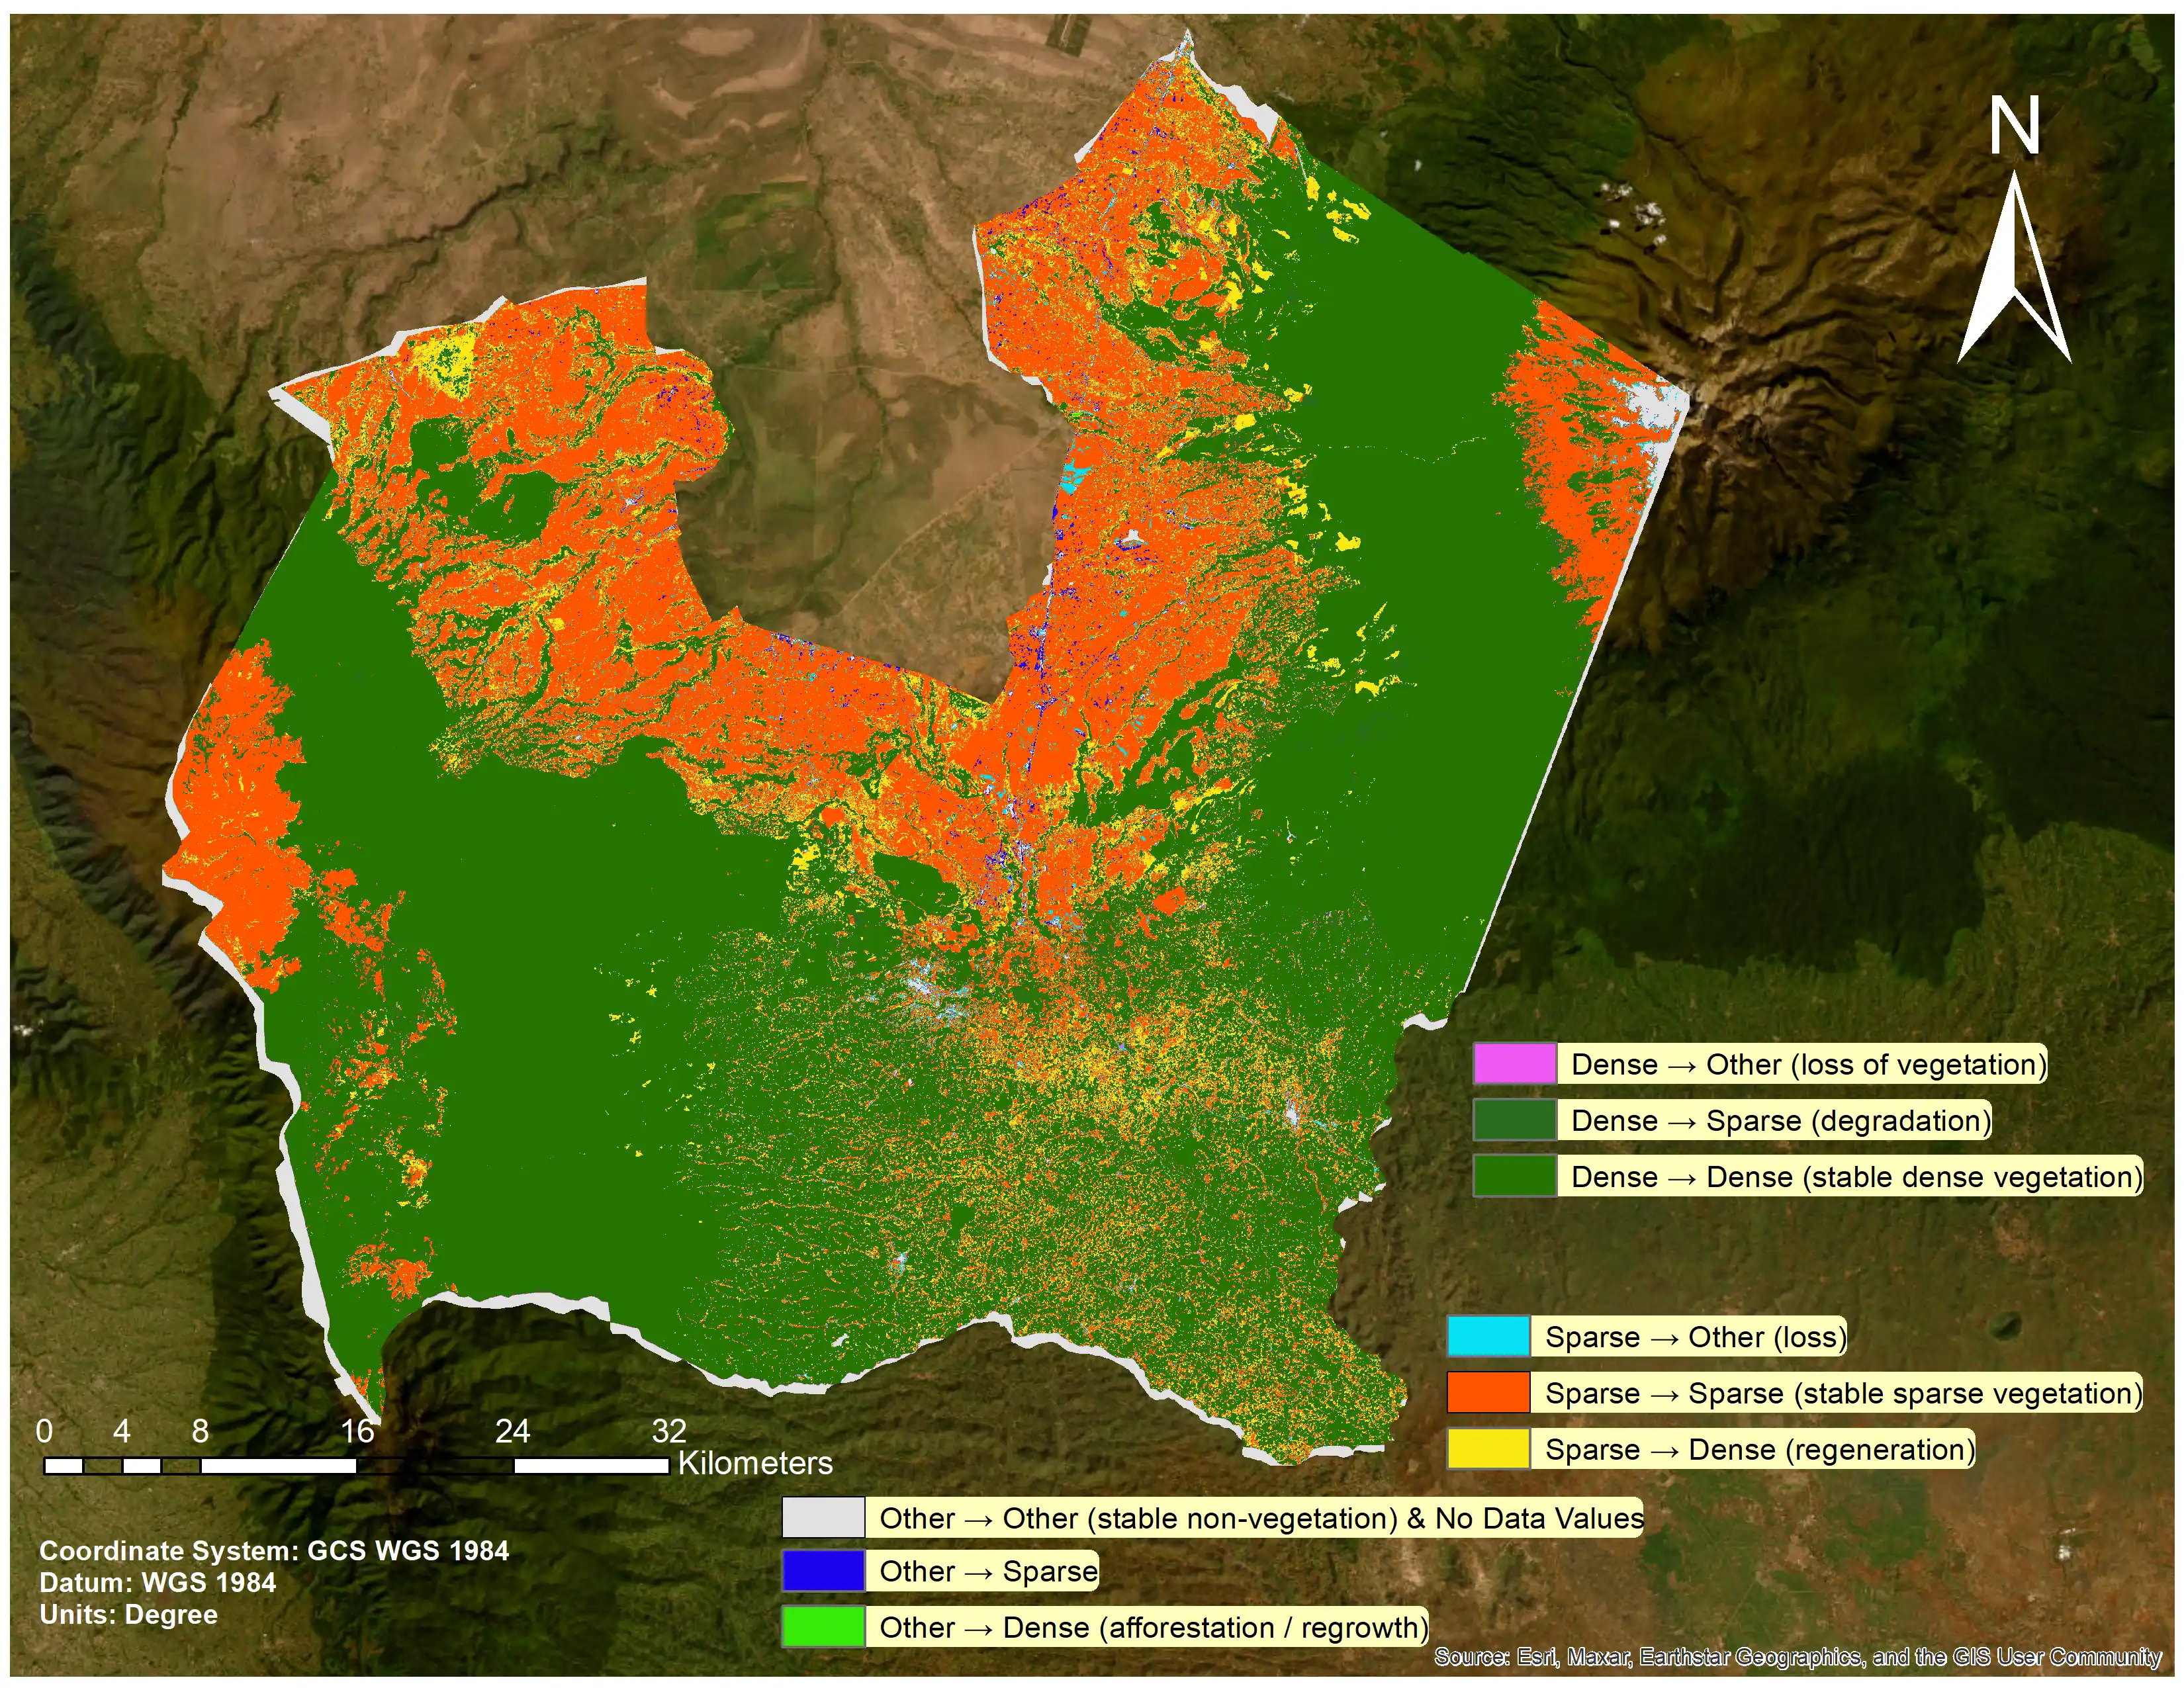
This is an example of change detection analysis, which compares imagery from different years to identify vegetation loss, regeneration, urban growth, and land cover transitions. These methods support environmental monitoring, planning, and sustainable resource management.
2017 & 2025 Comparison
Overlay
Spatial Risk Assessment
This is an example of GIS-based risk assessment, which identifies hazard-prone areas and supports evidence-based planning through spatial analytics.
Accident Distribution Analysis
Kernel Density Hotspot Analysis
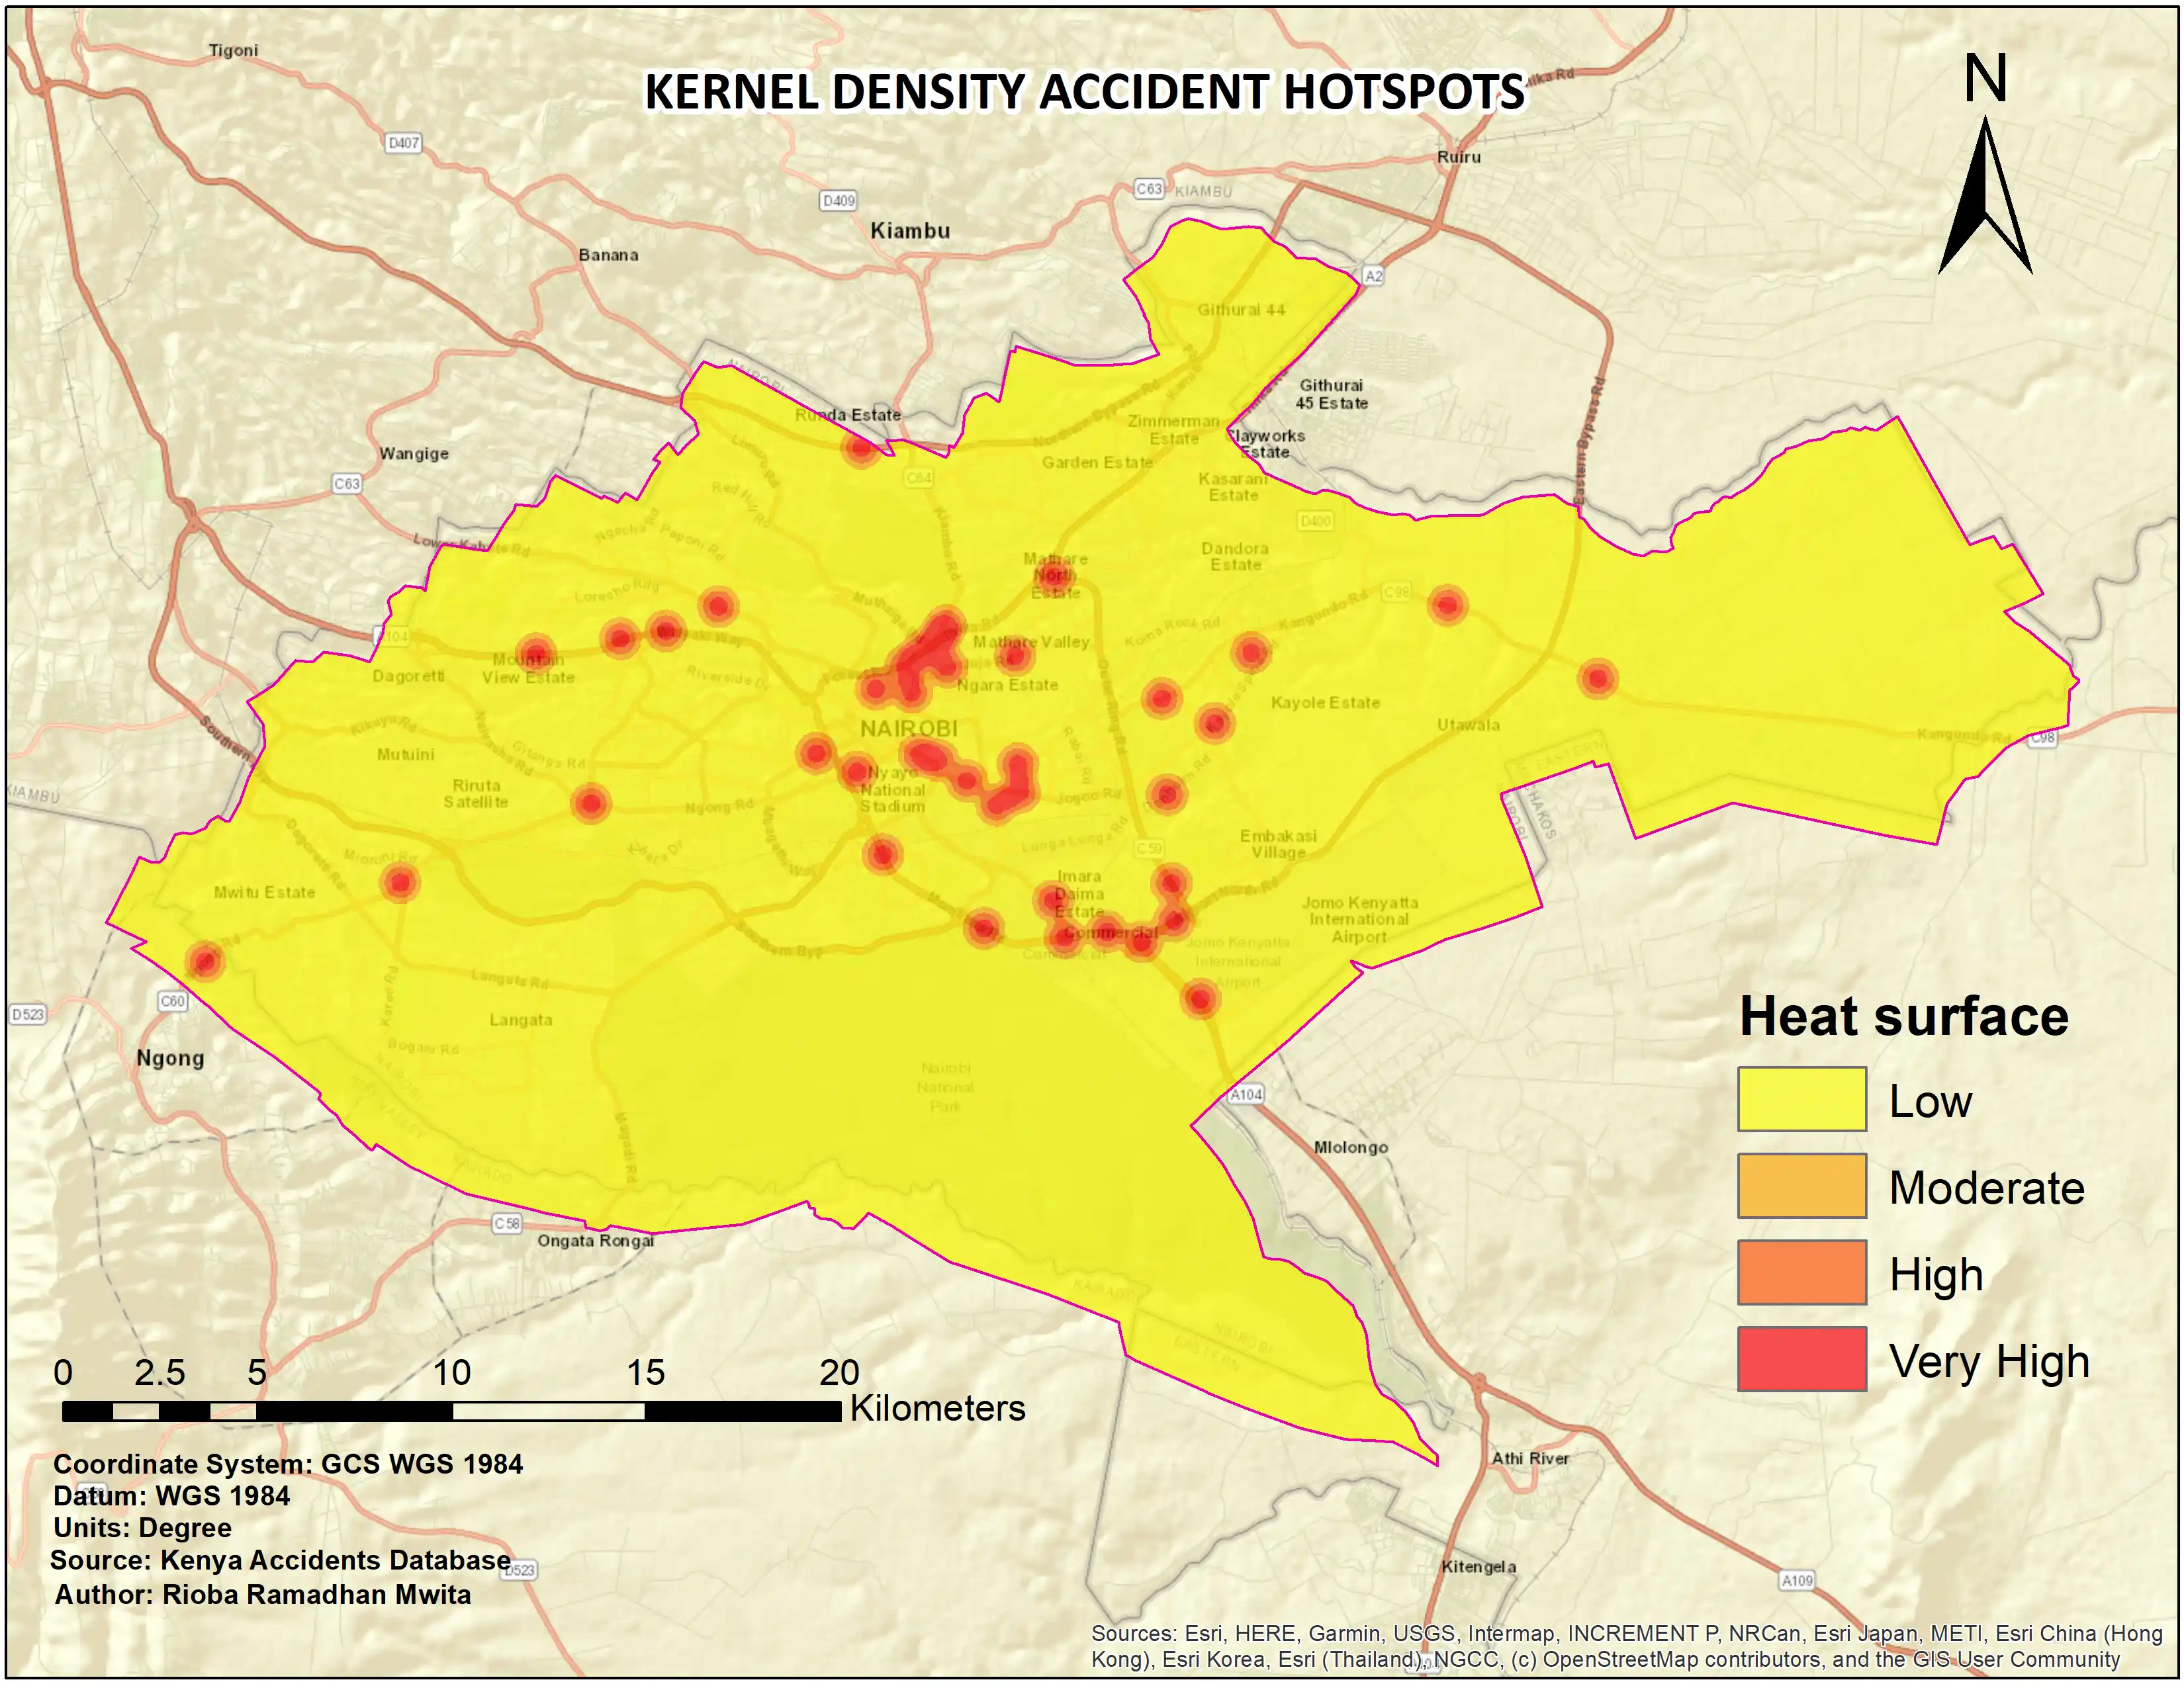
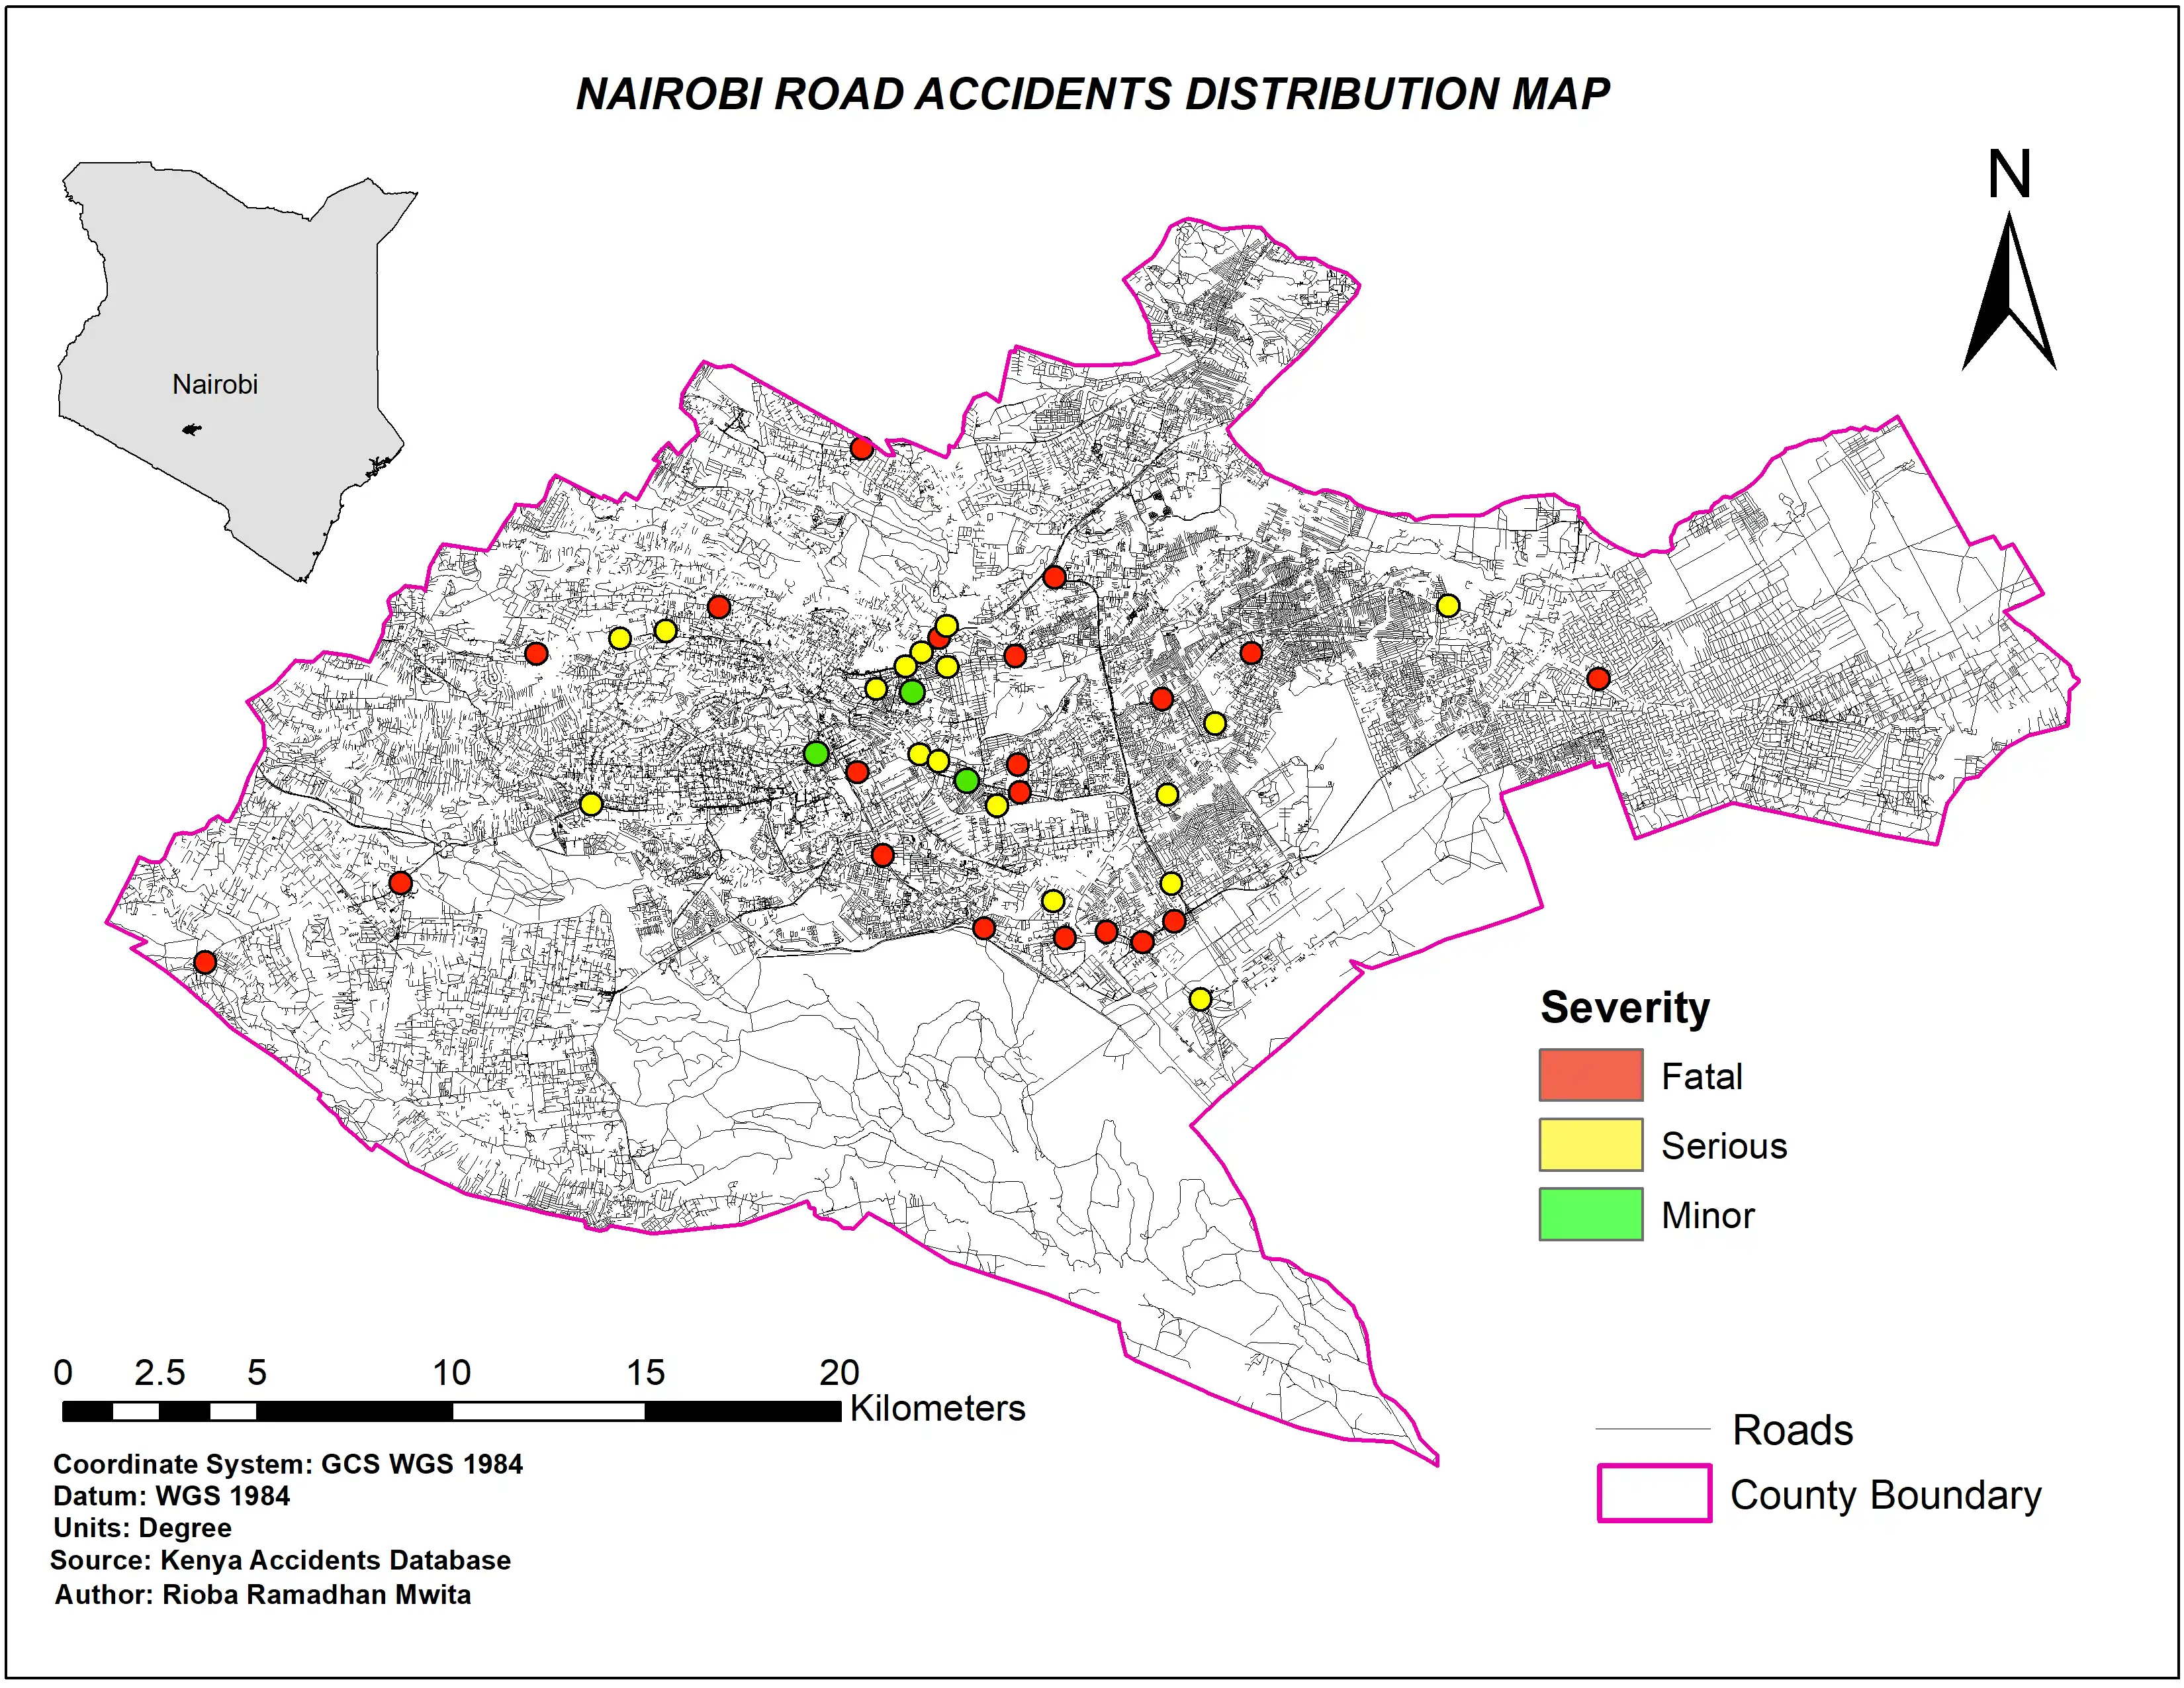
Using accident records, kernel density analysis identifies high-risk corridors and hotspots. Similar methods can be applied to flood risk mapping, environmental hazards, disease mapping and vulnerability assessments.
Site Suitability Analysis PROJECT
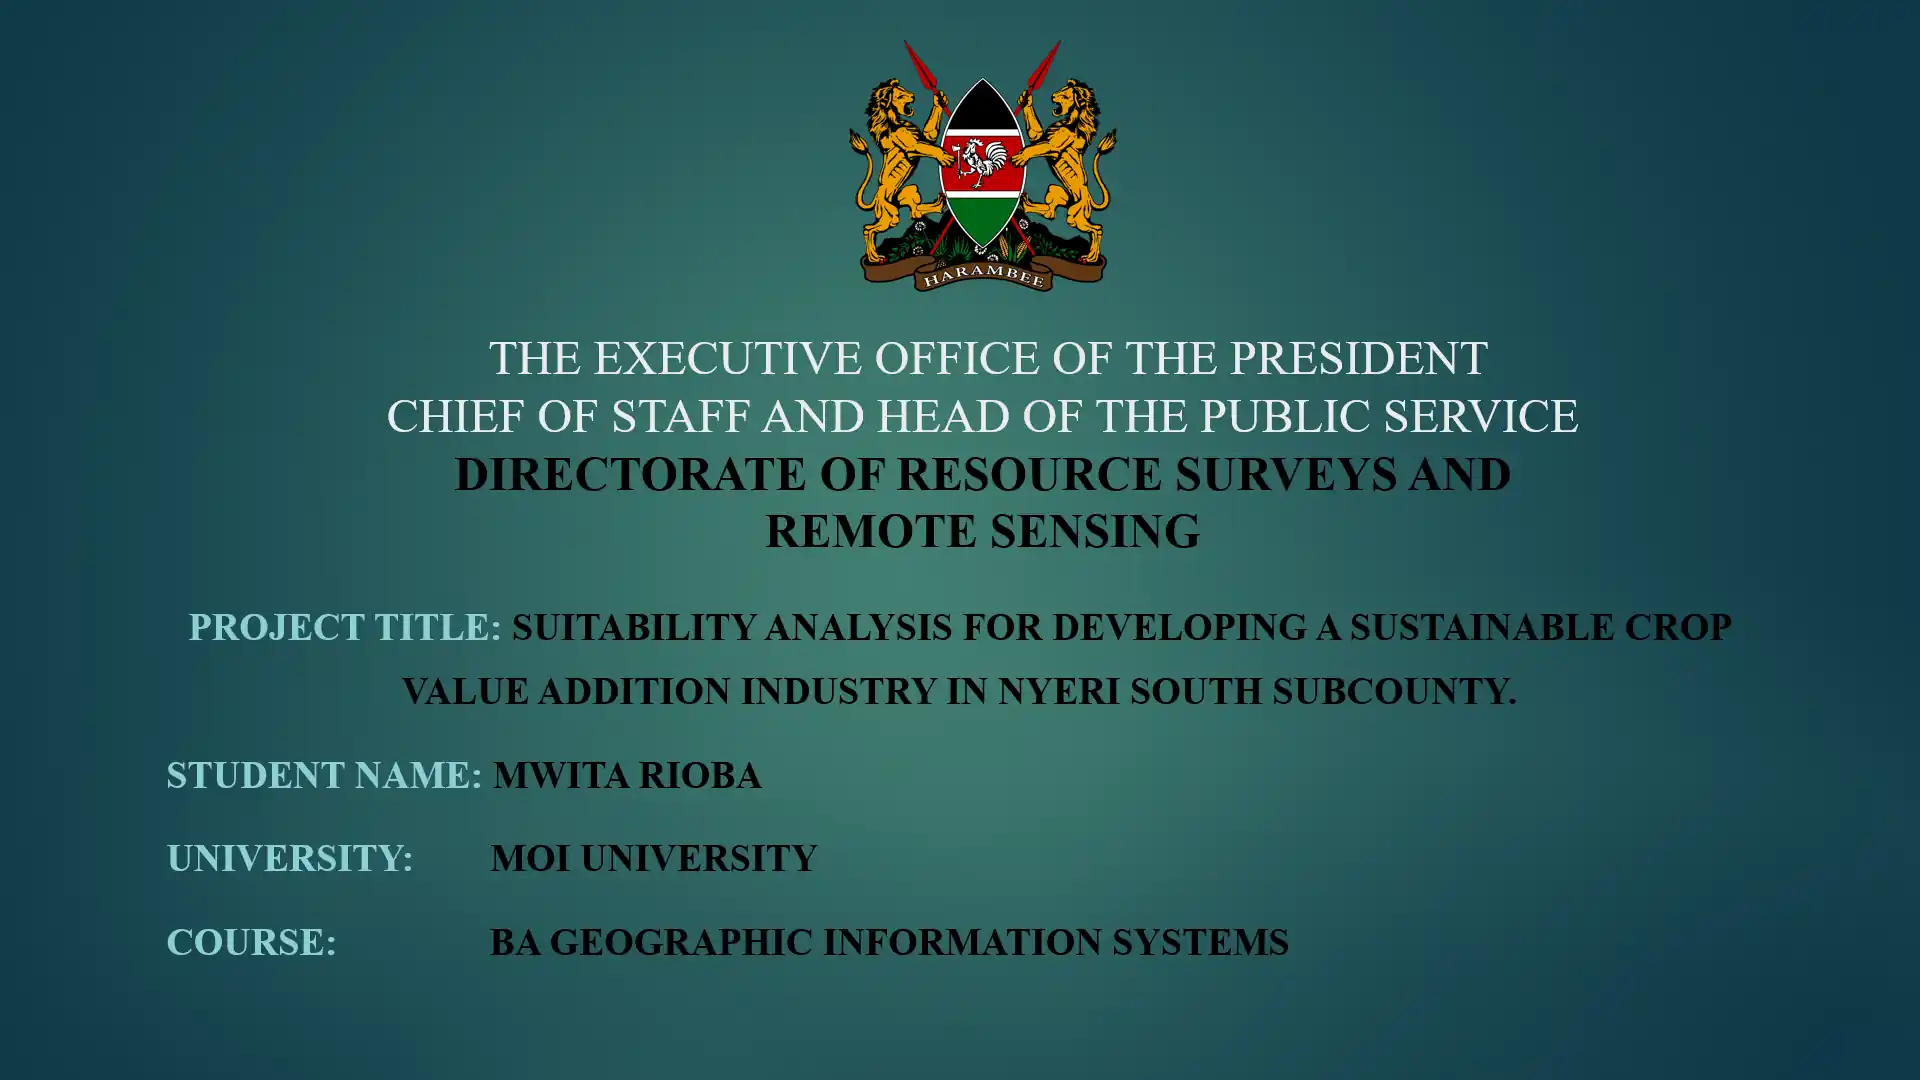
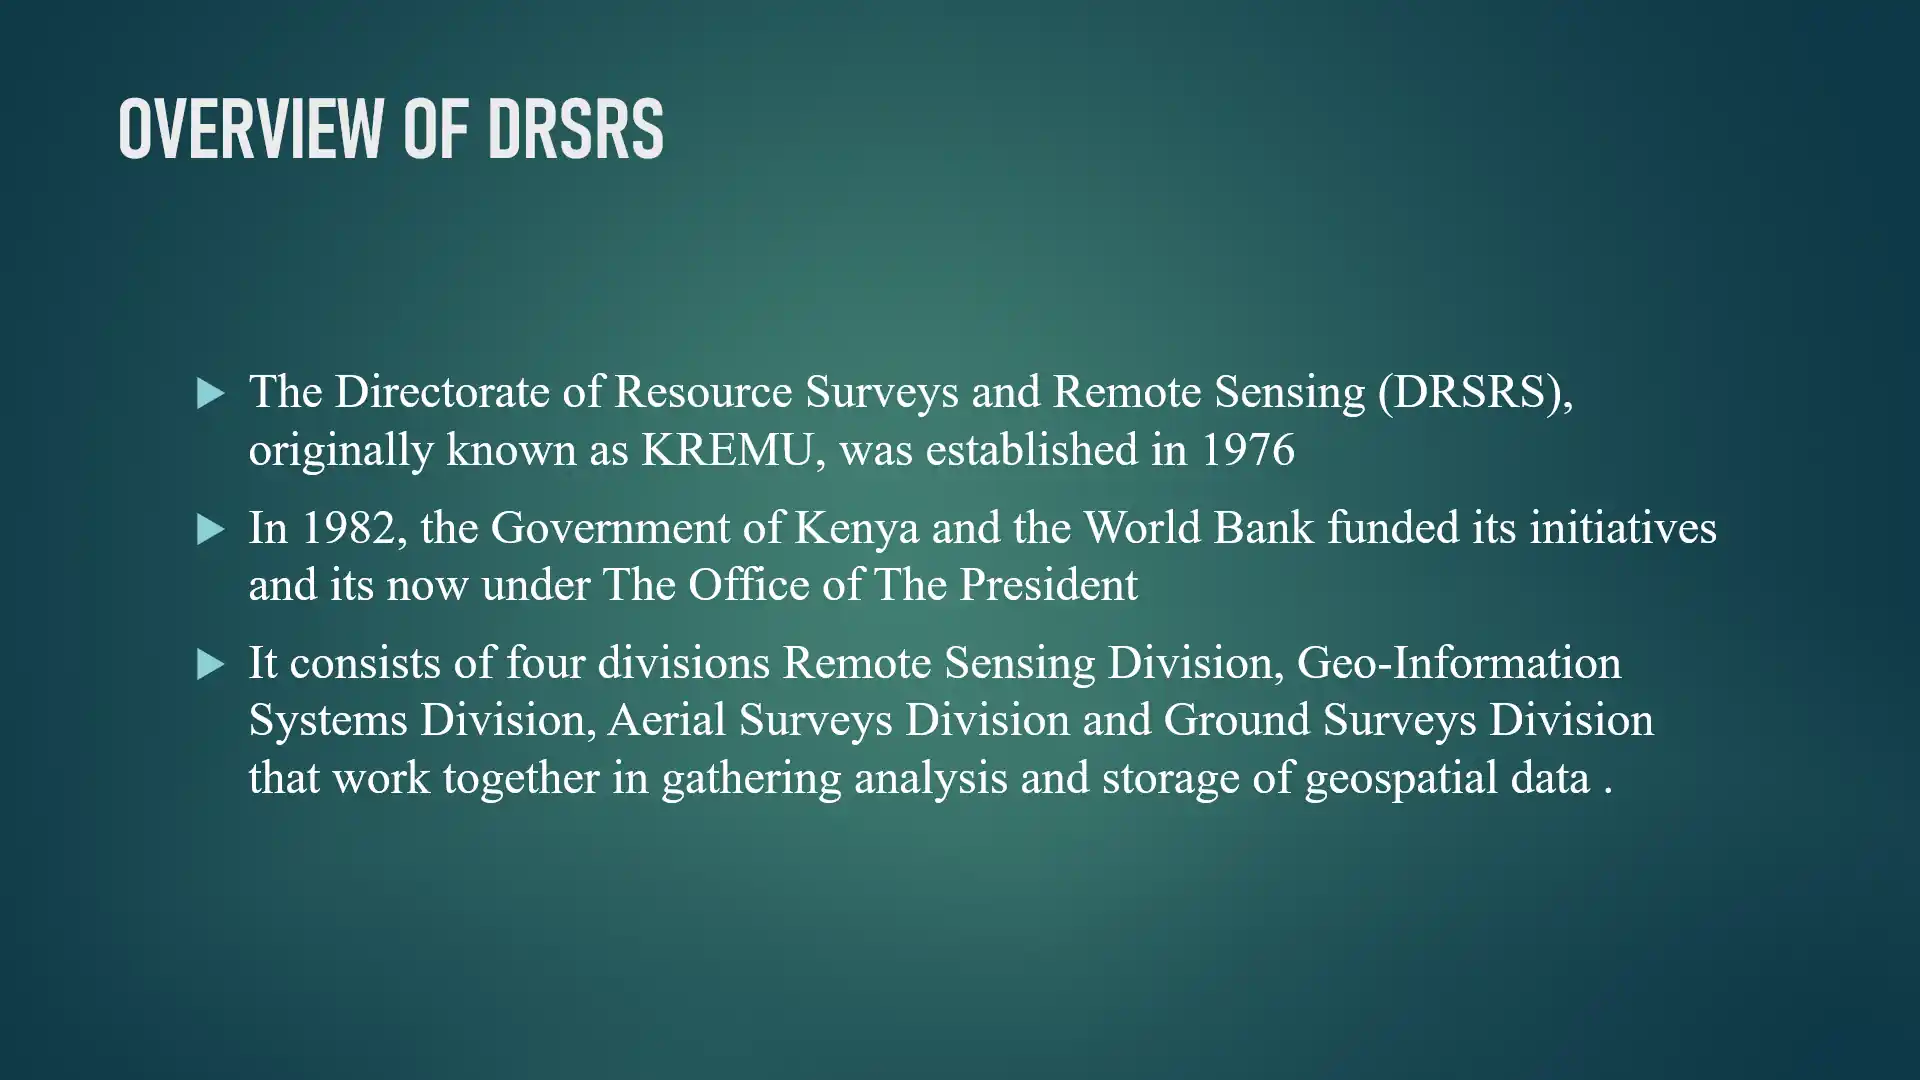
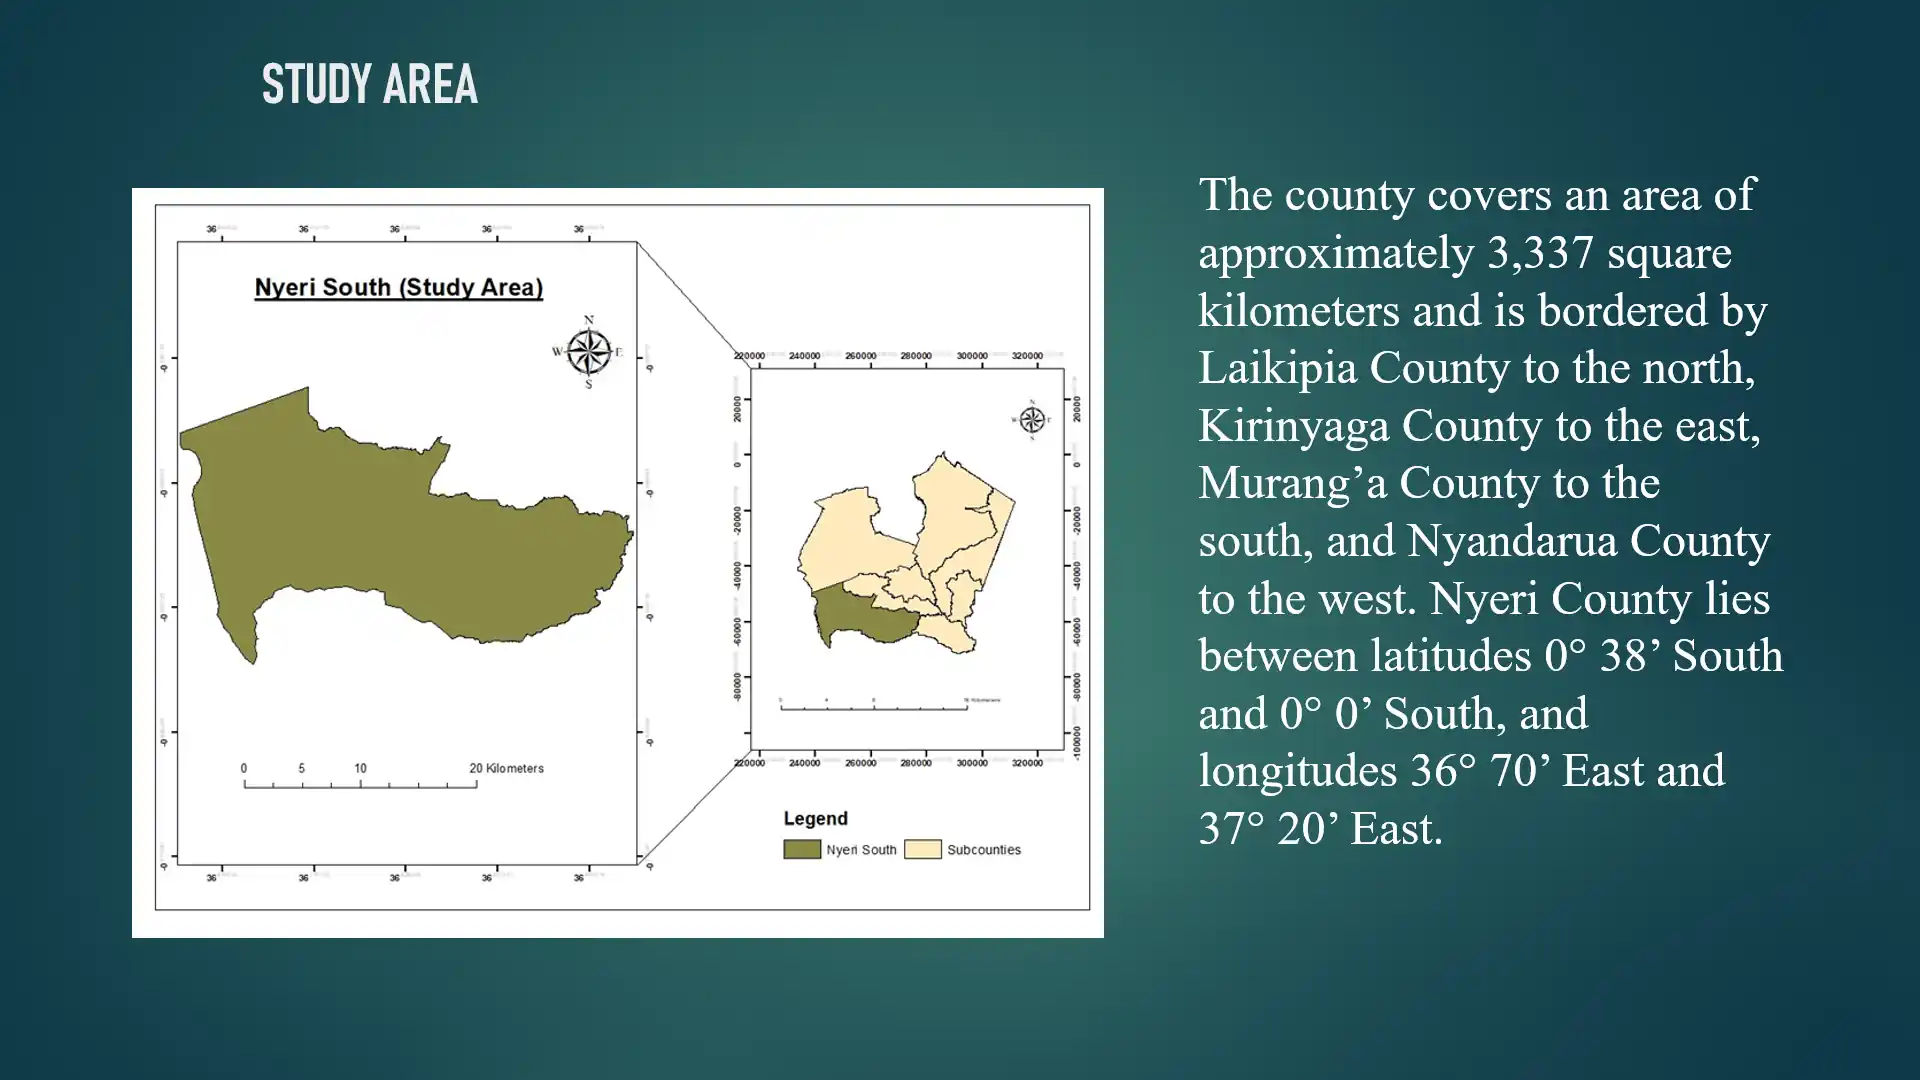
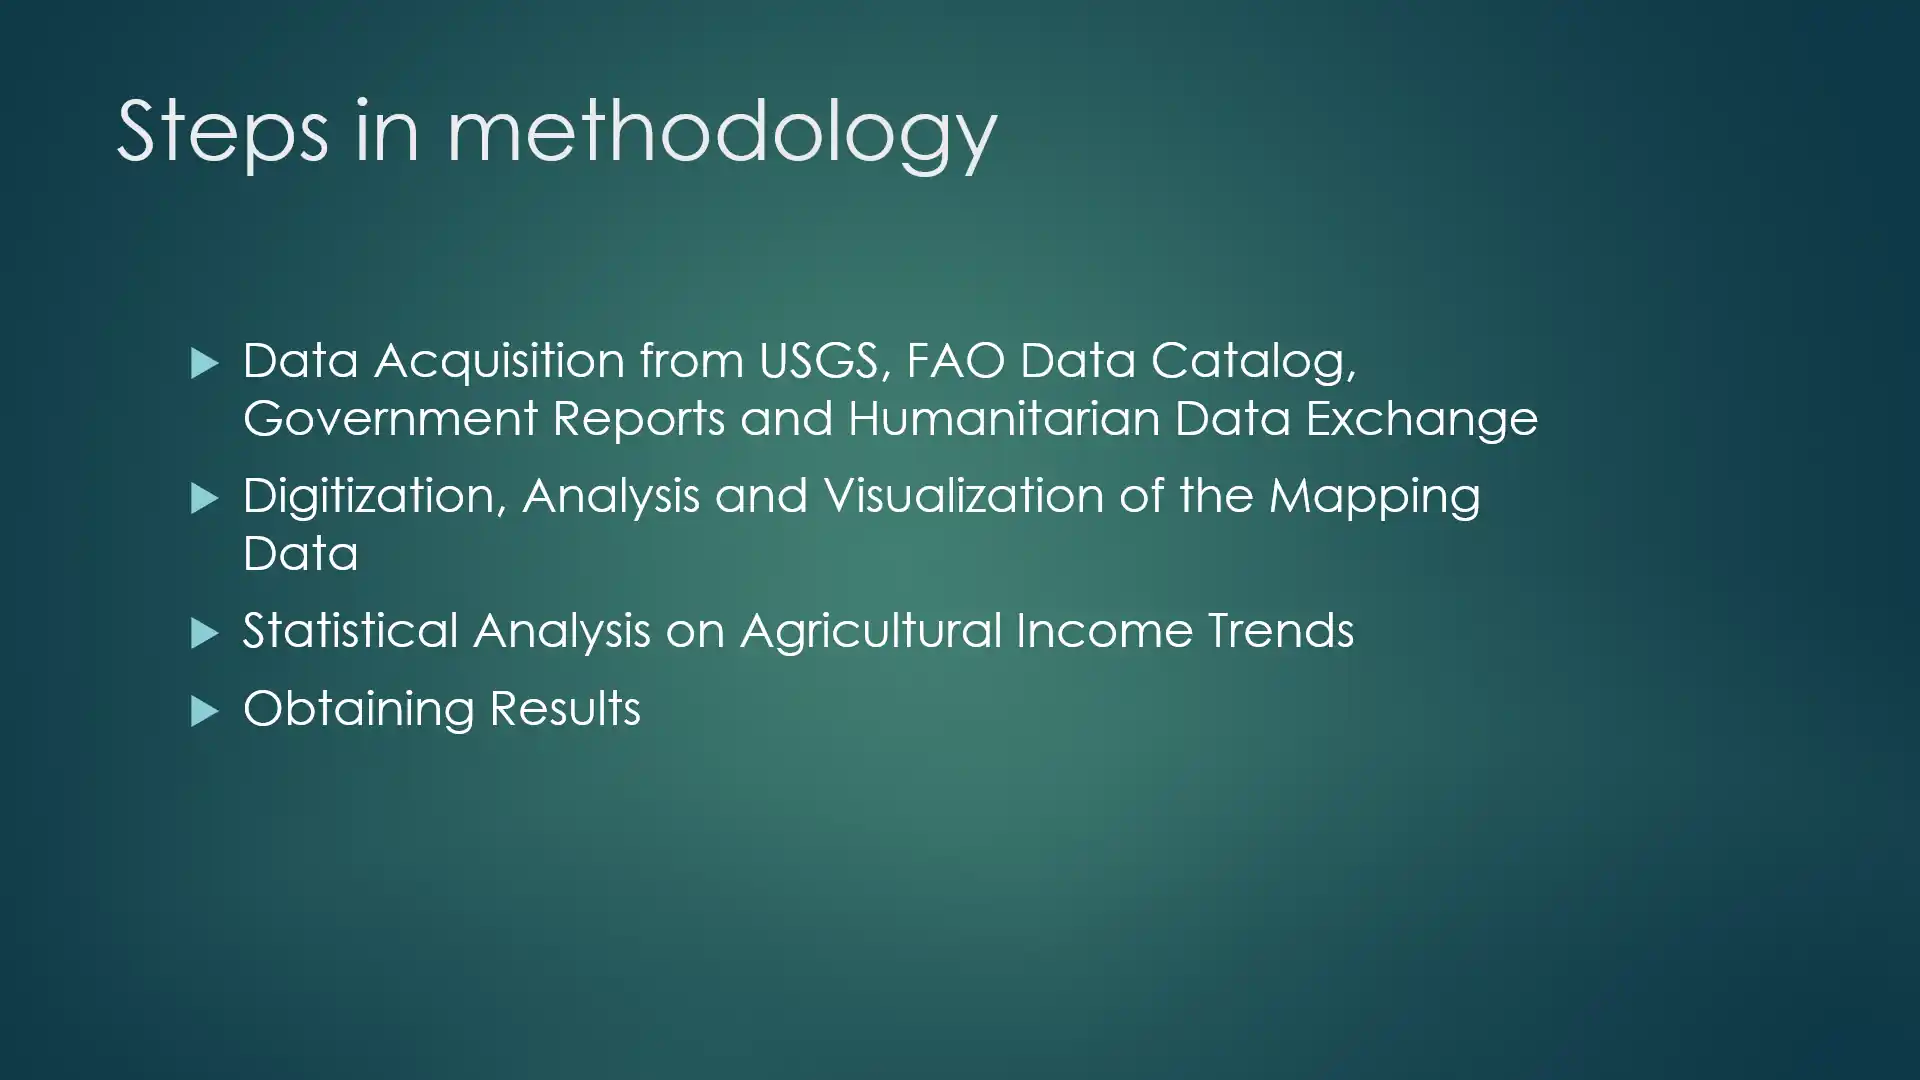
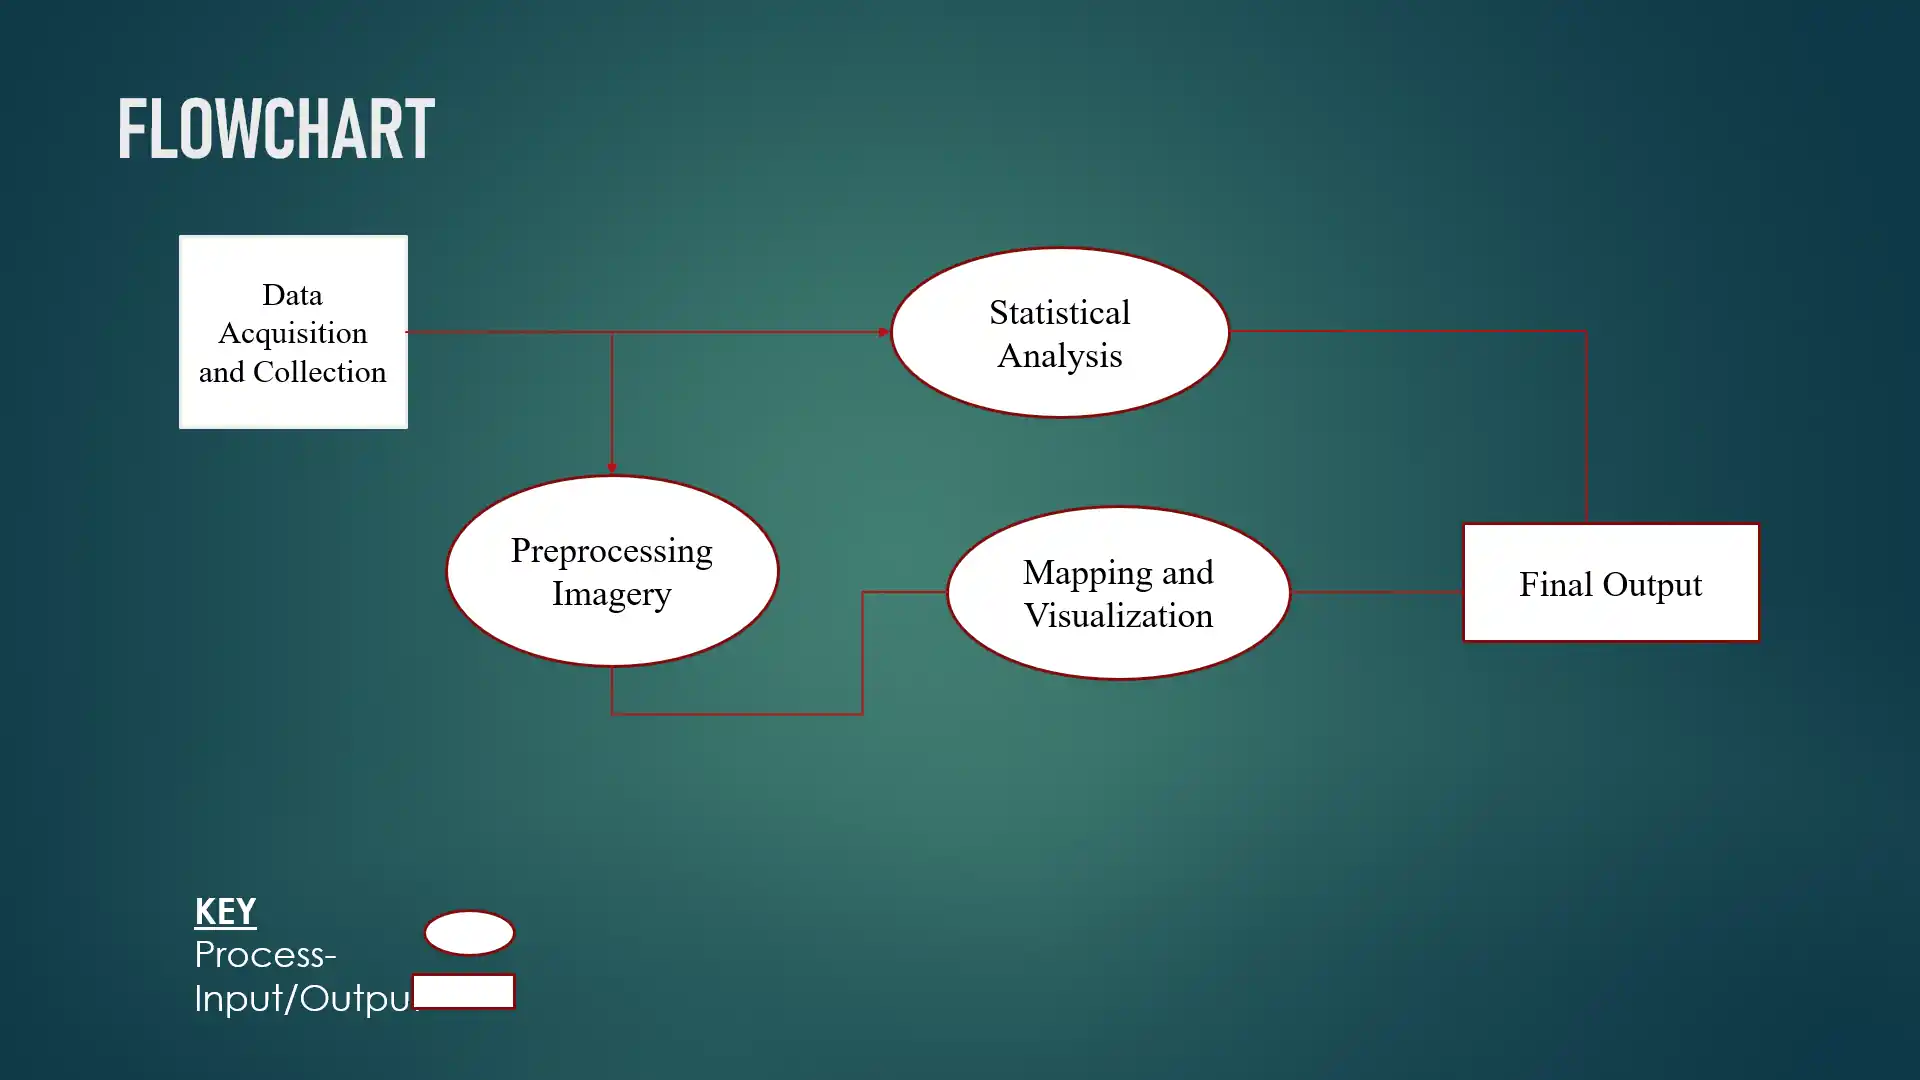
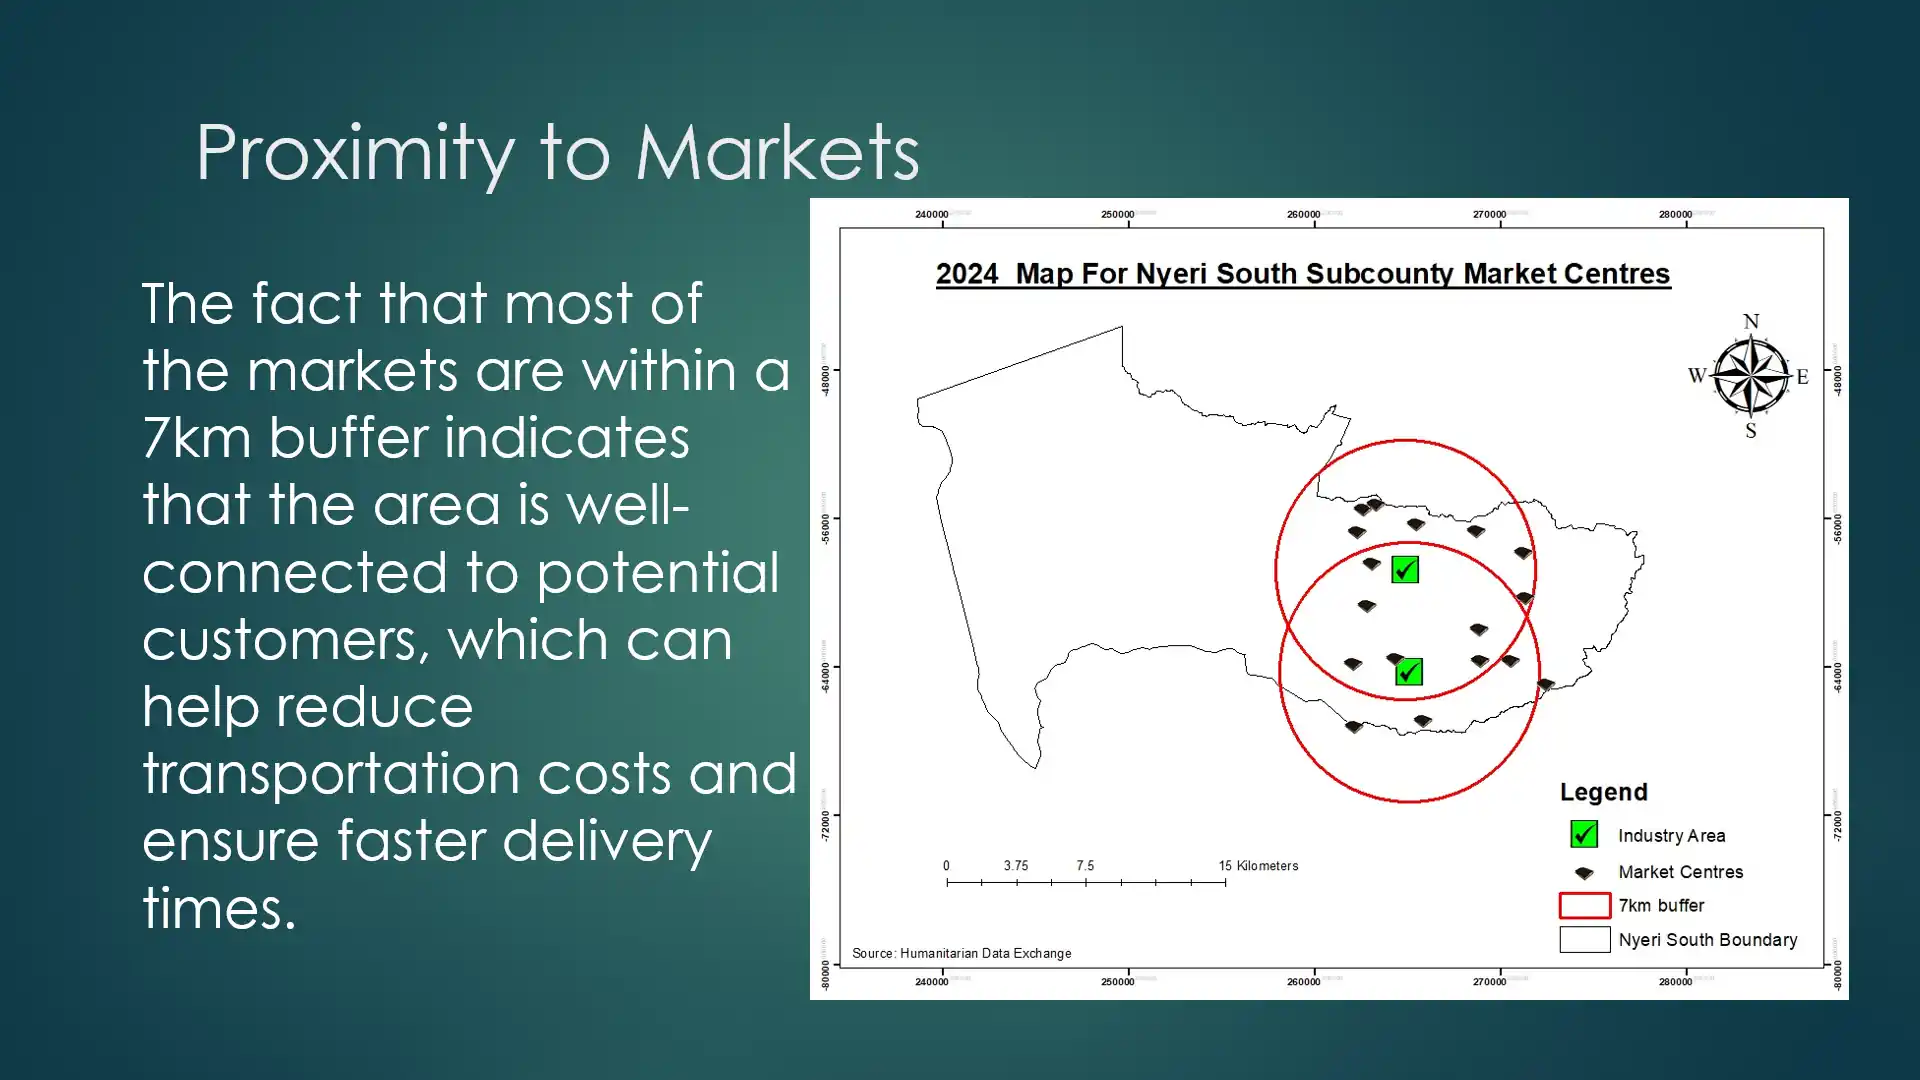
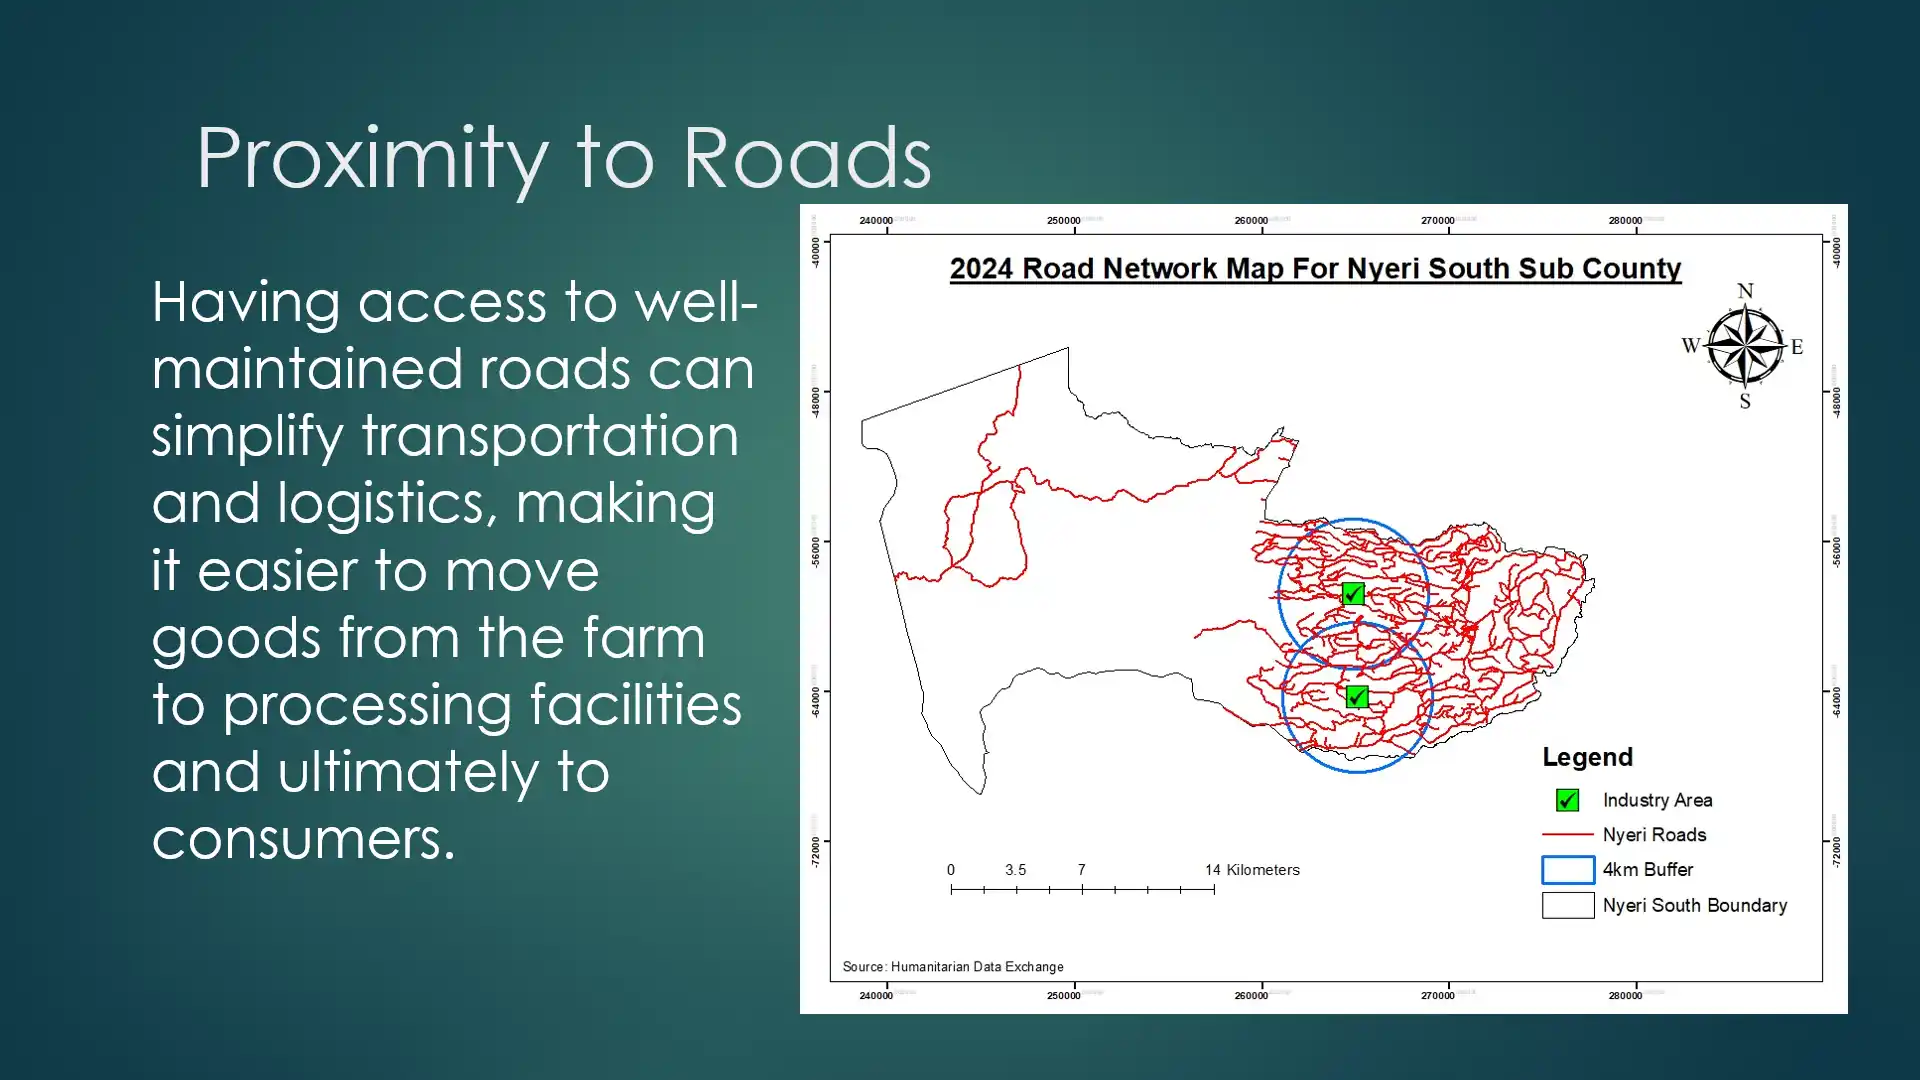
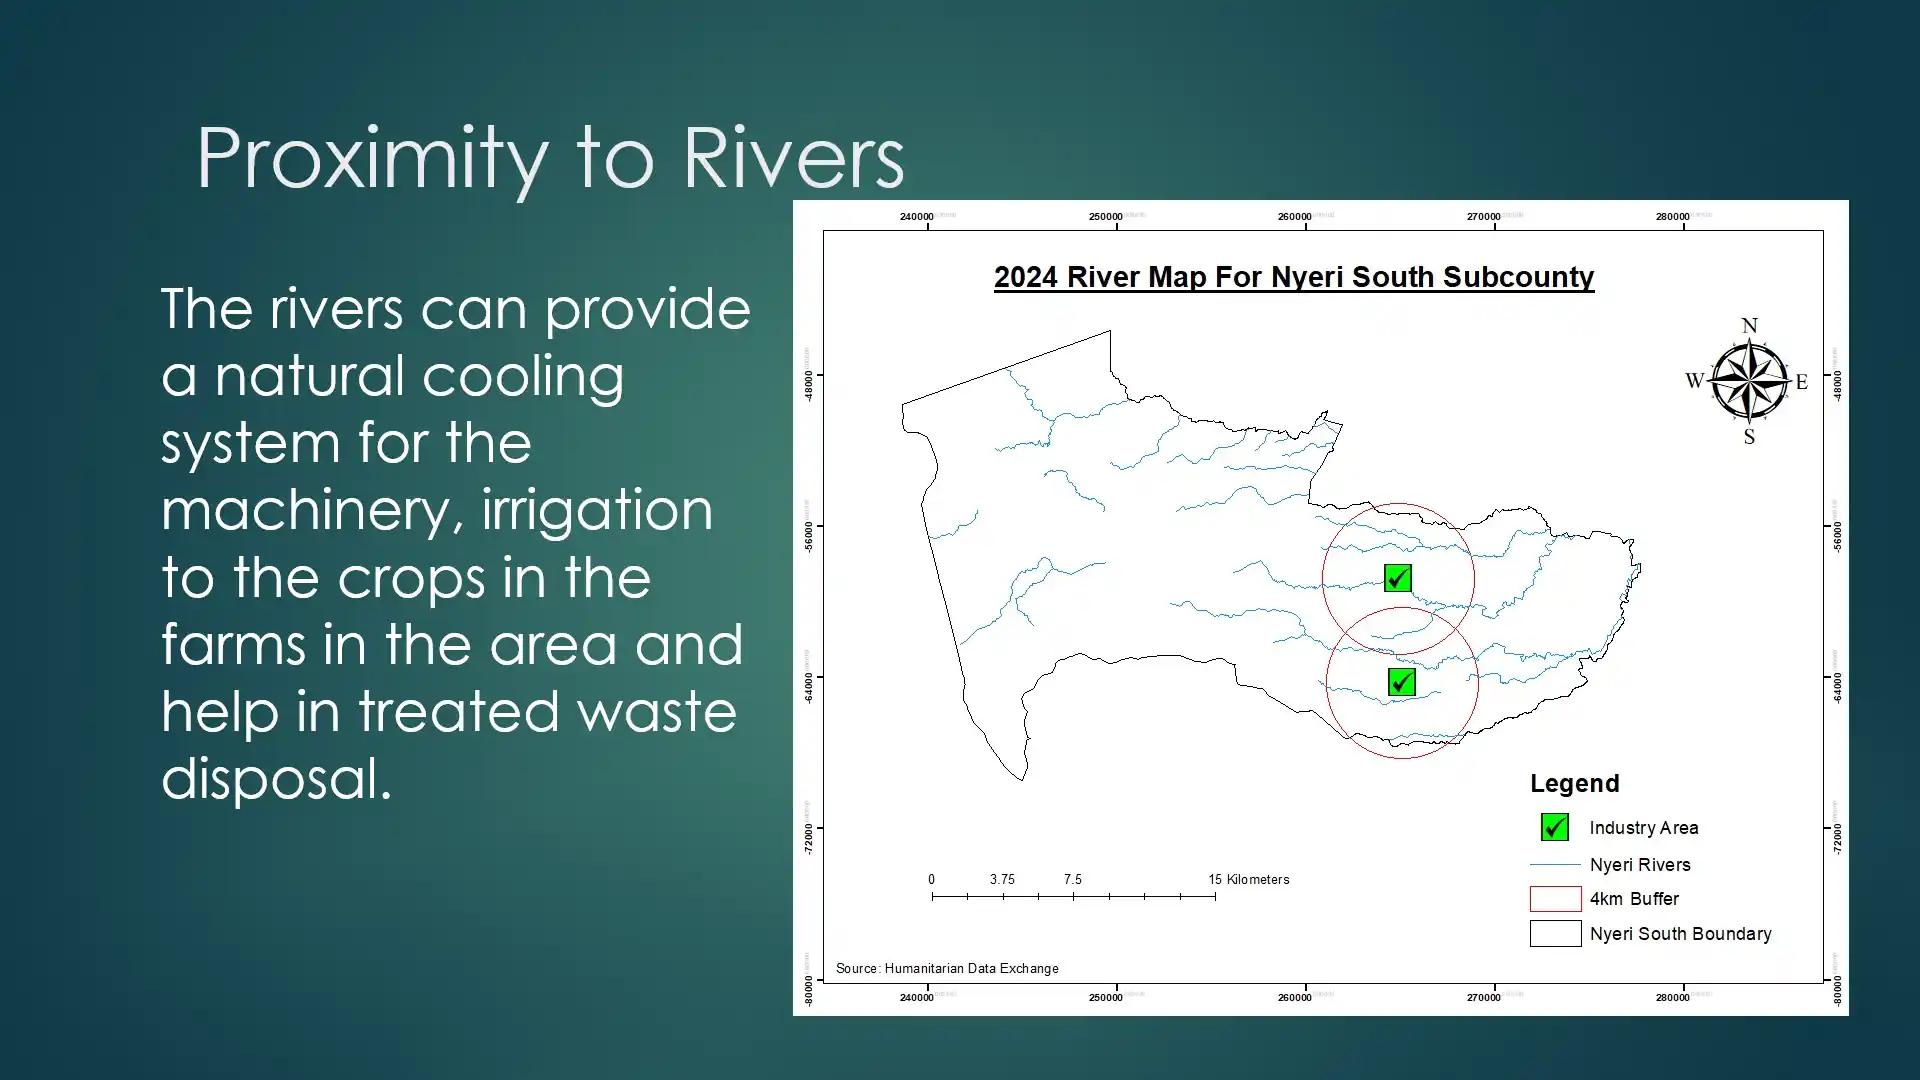
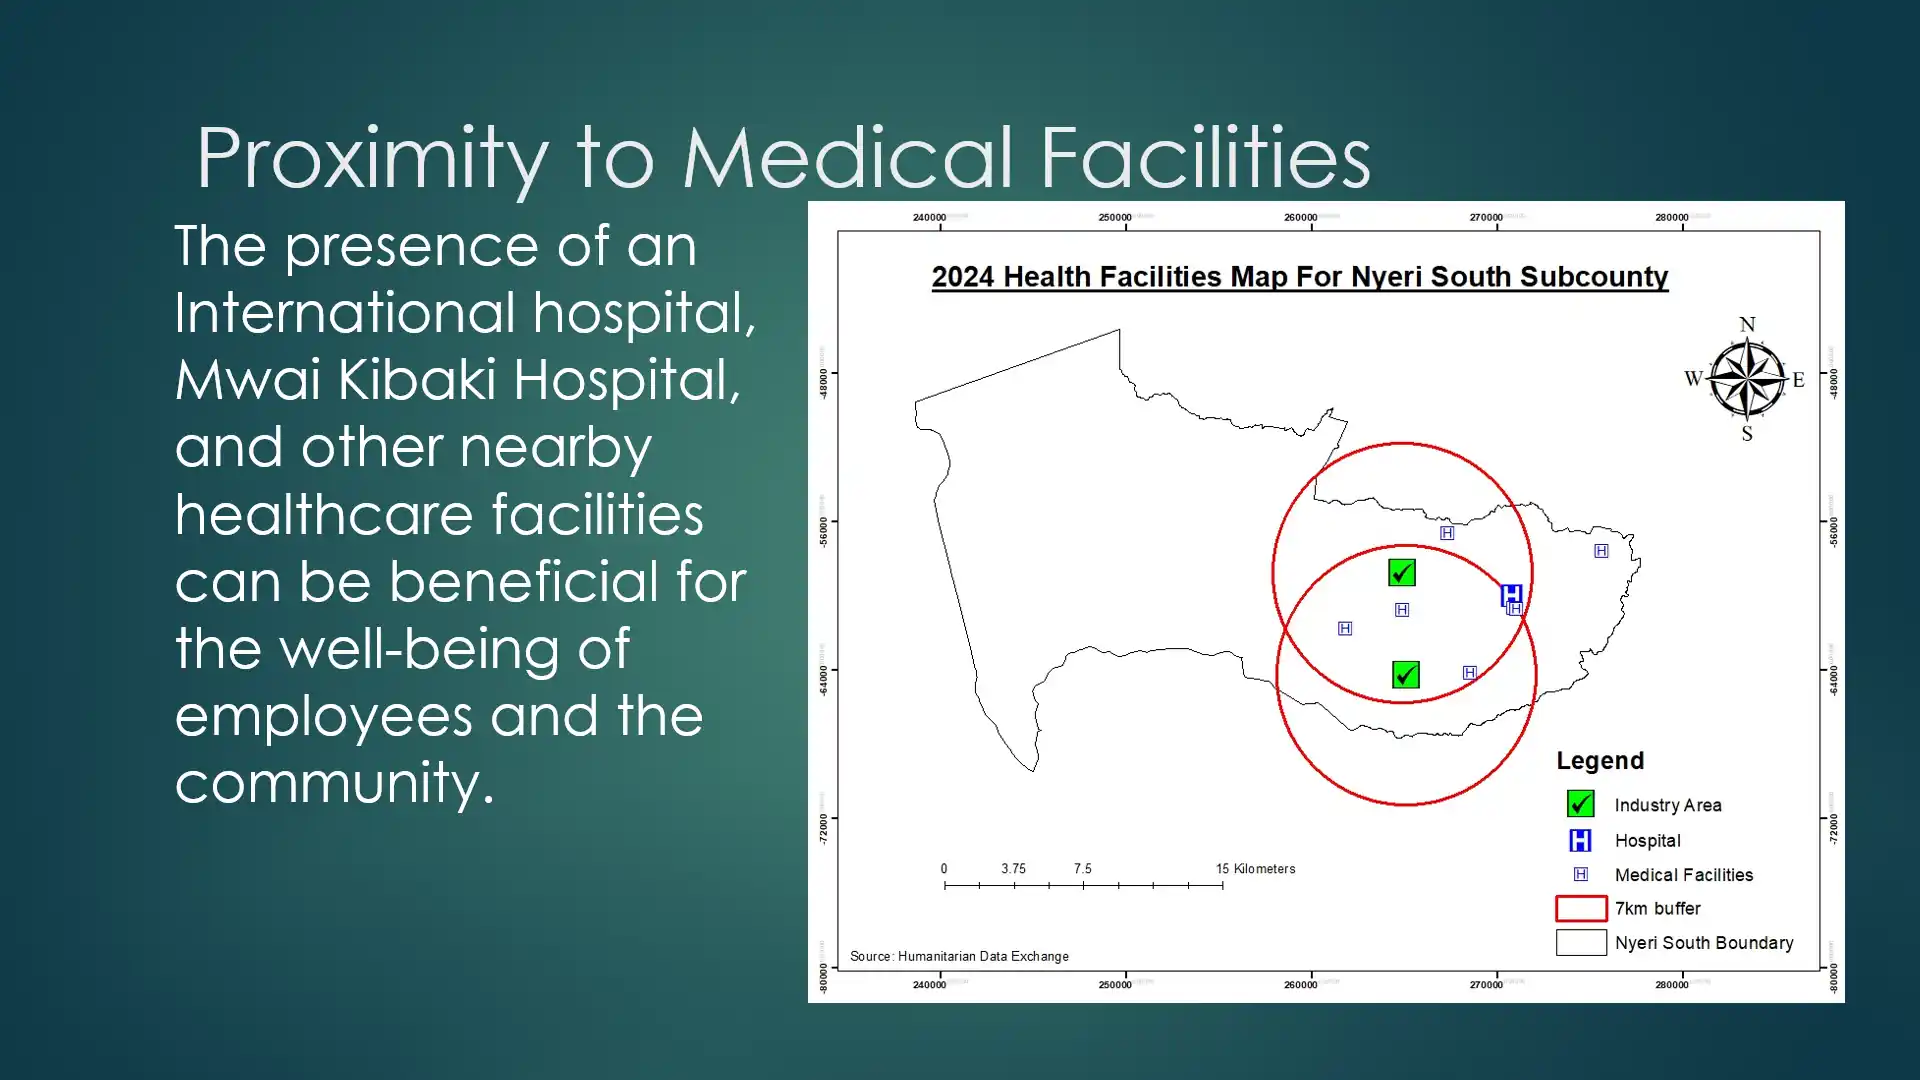
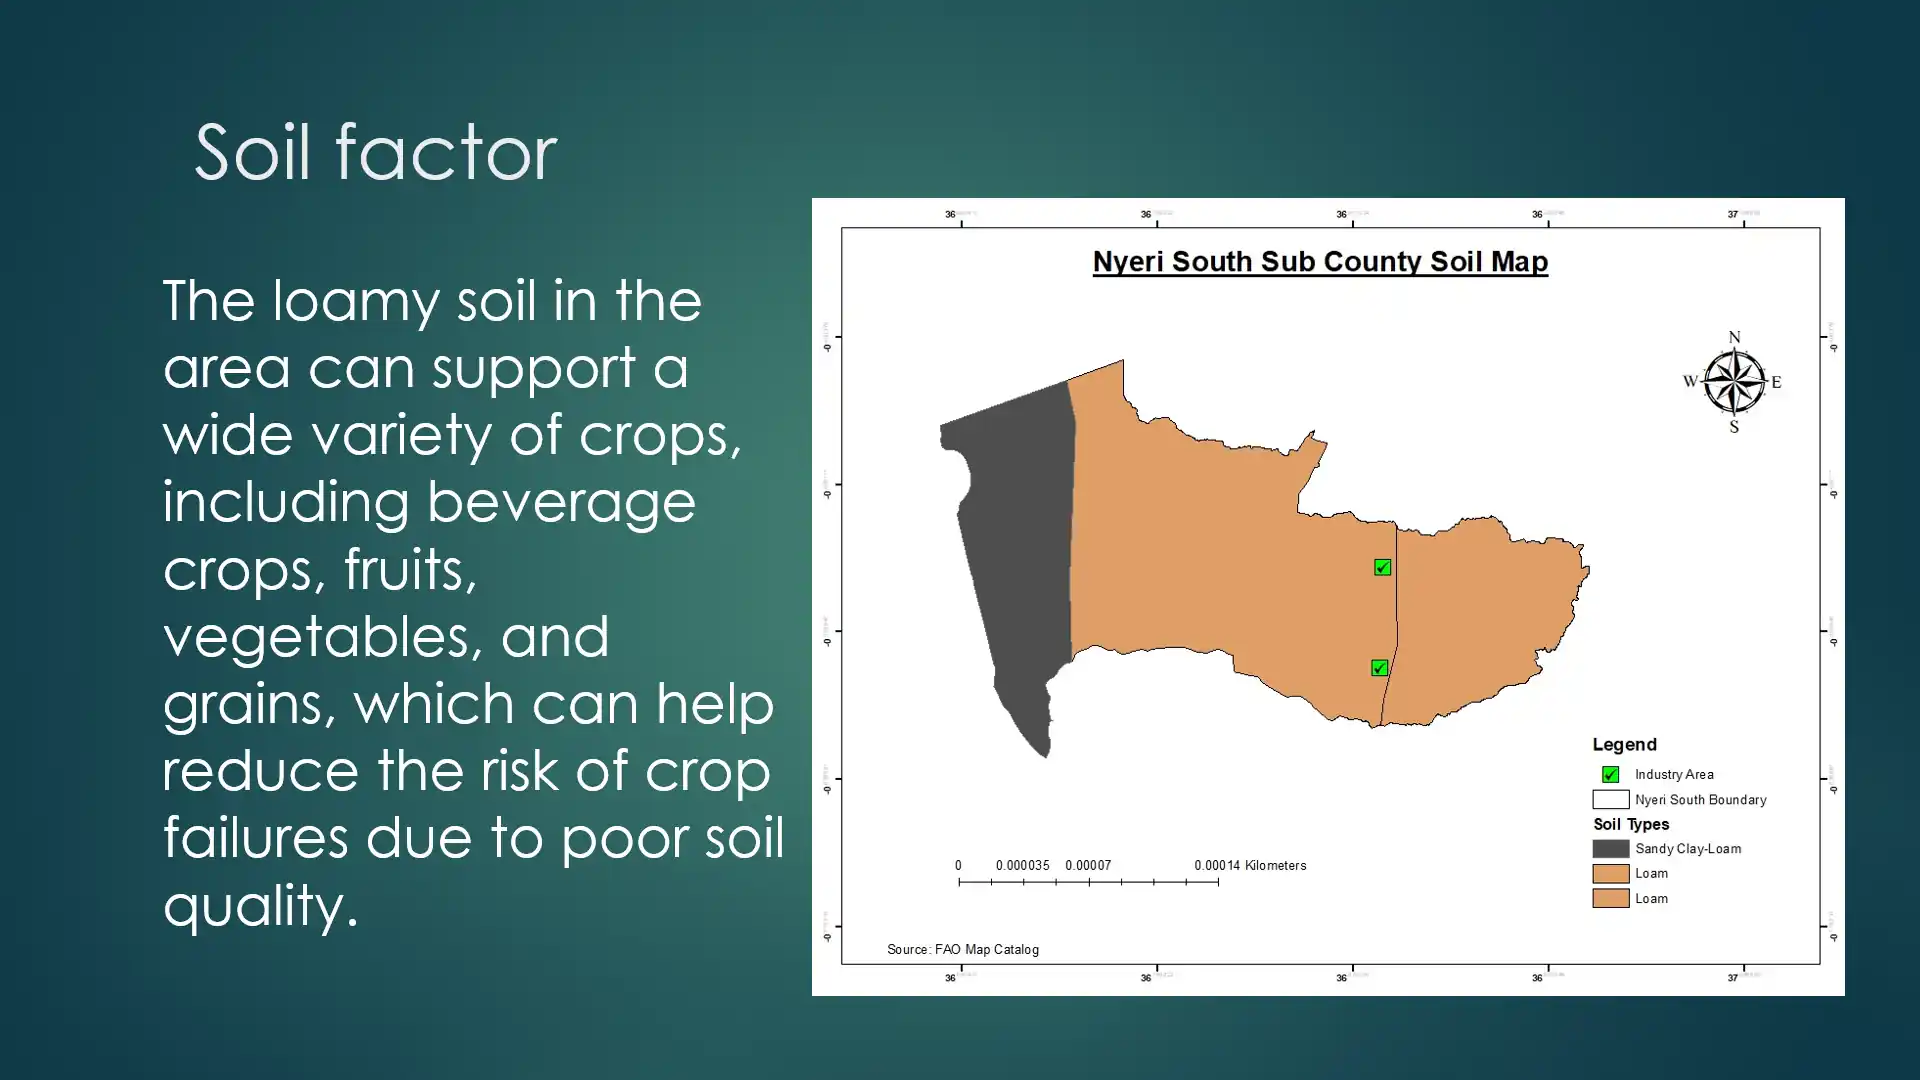
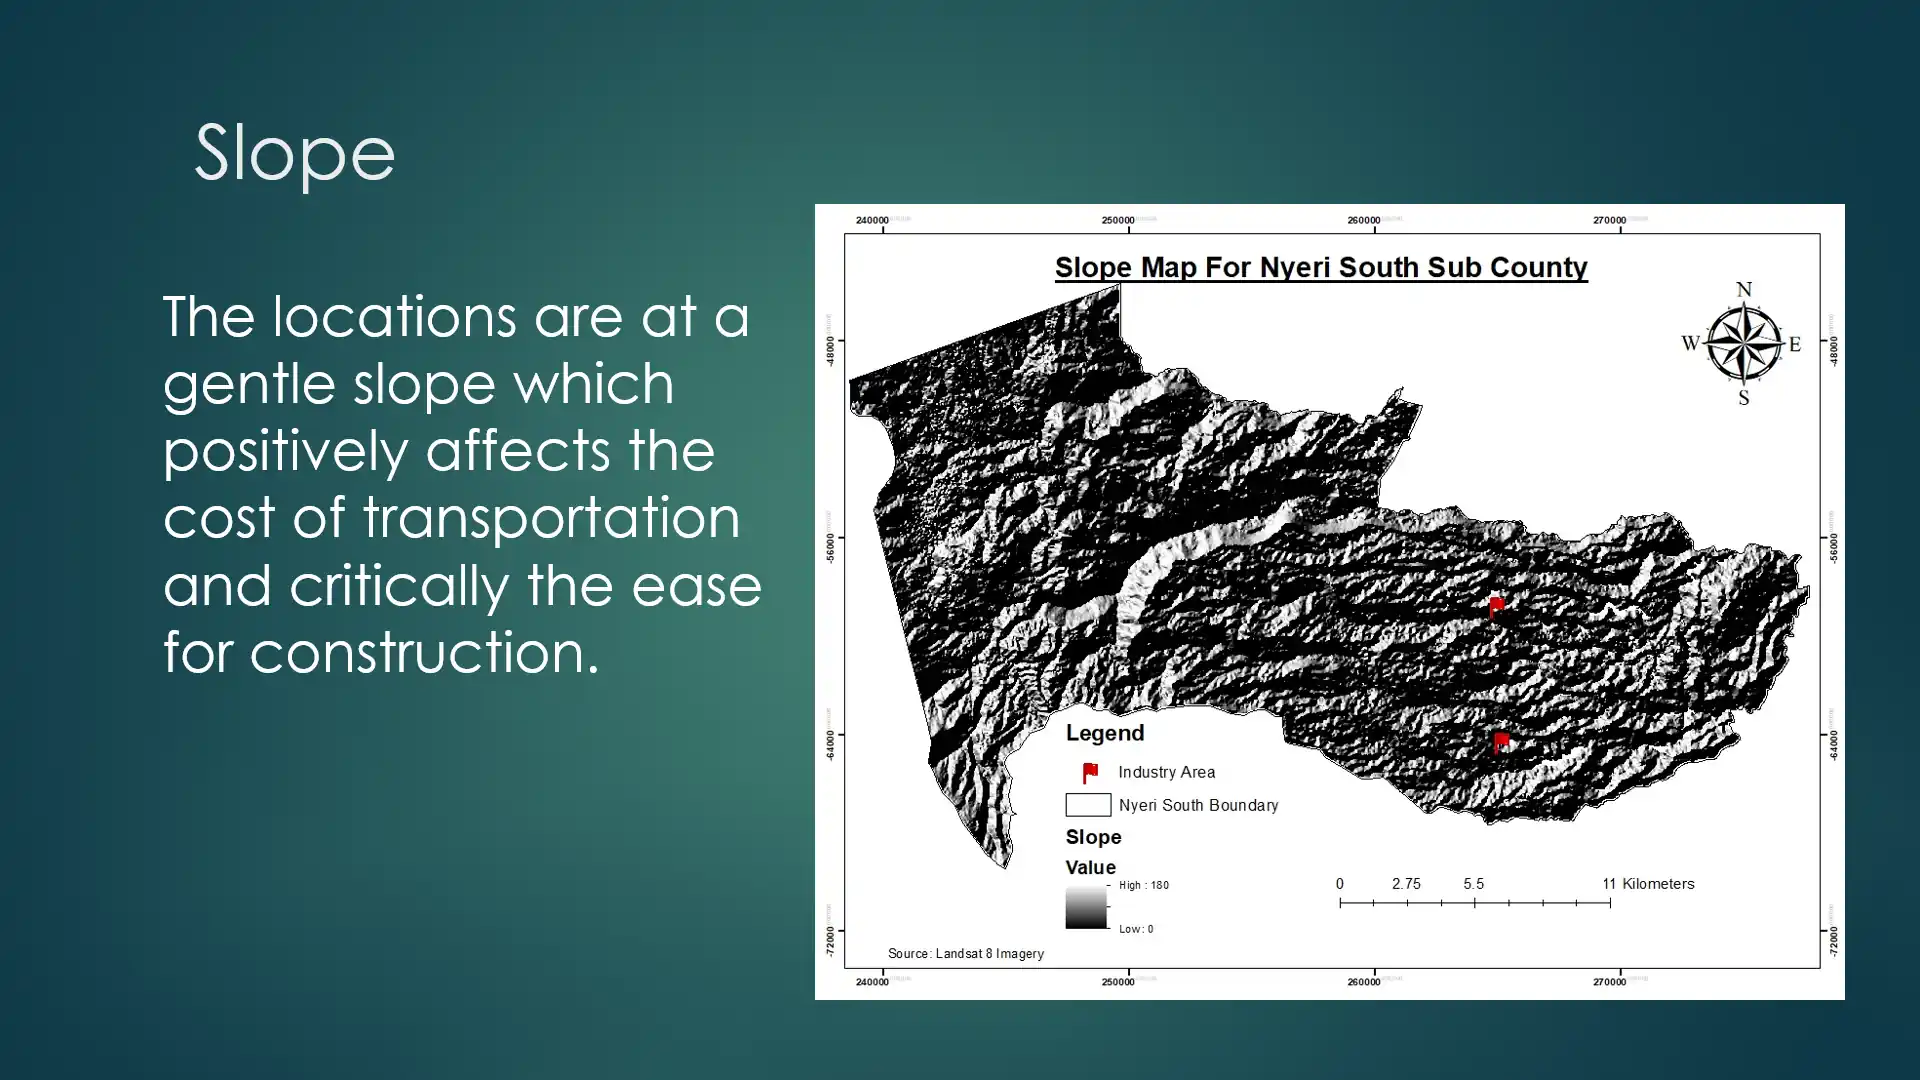
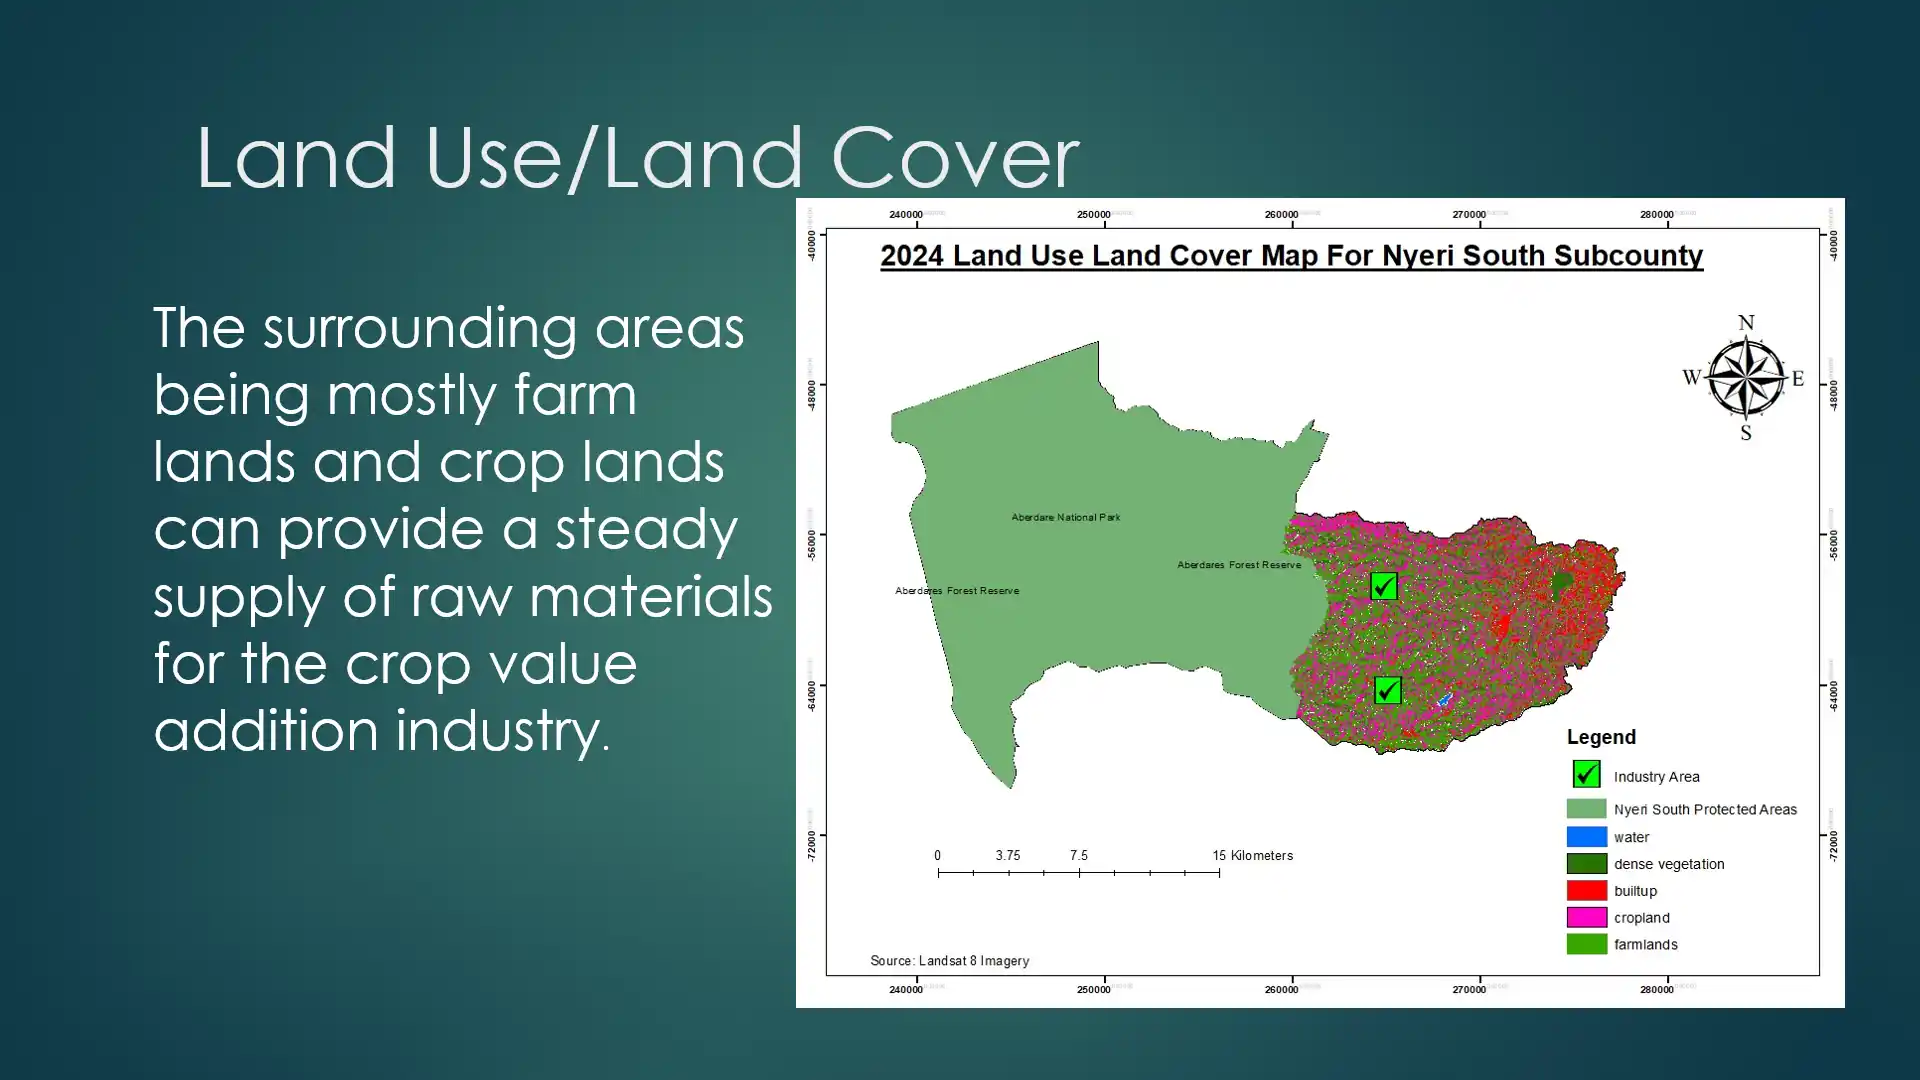
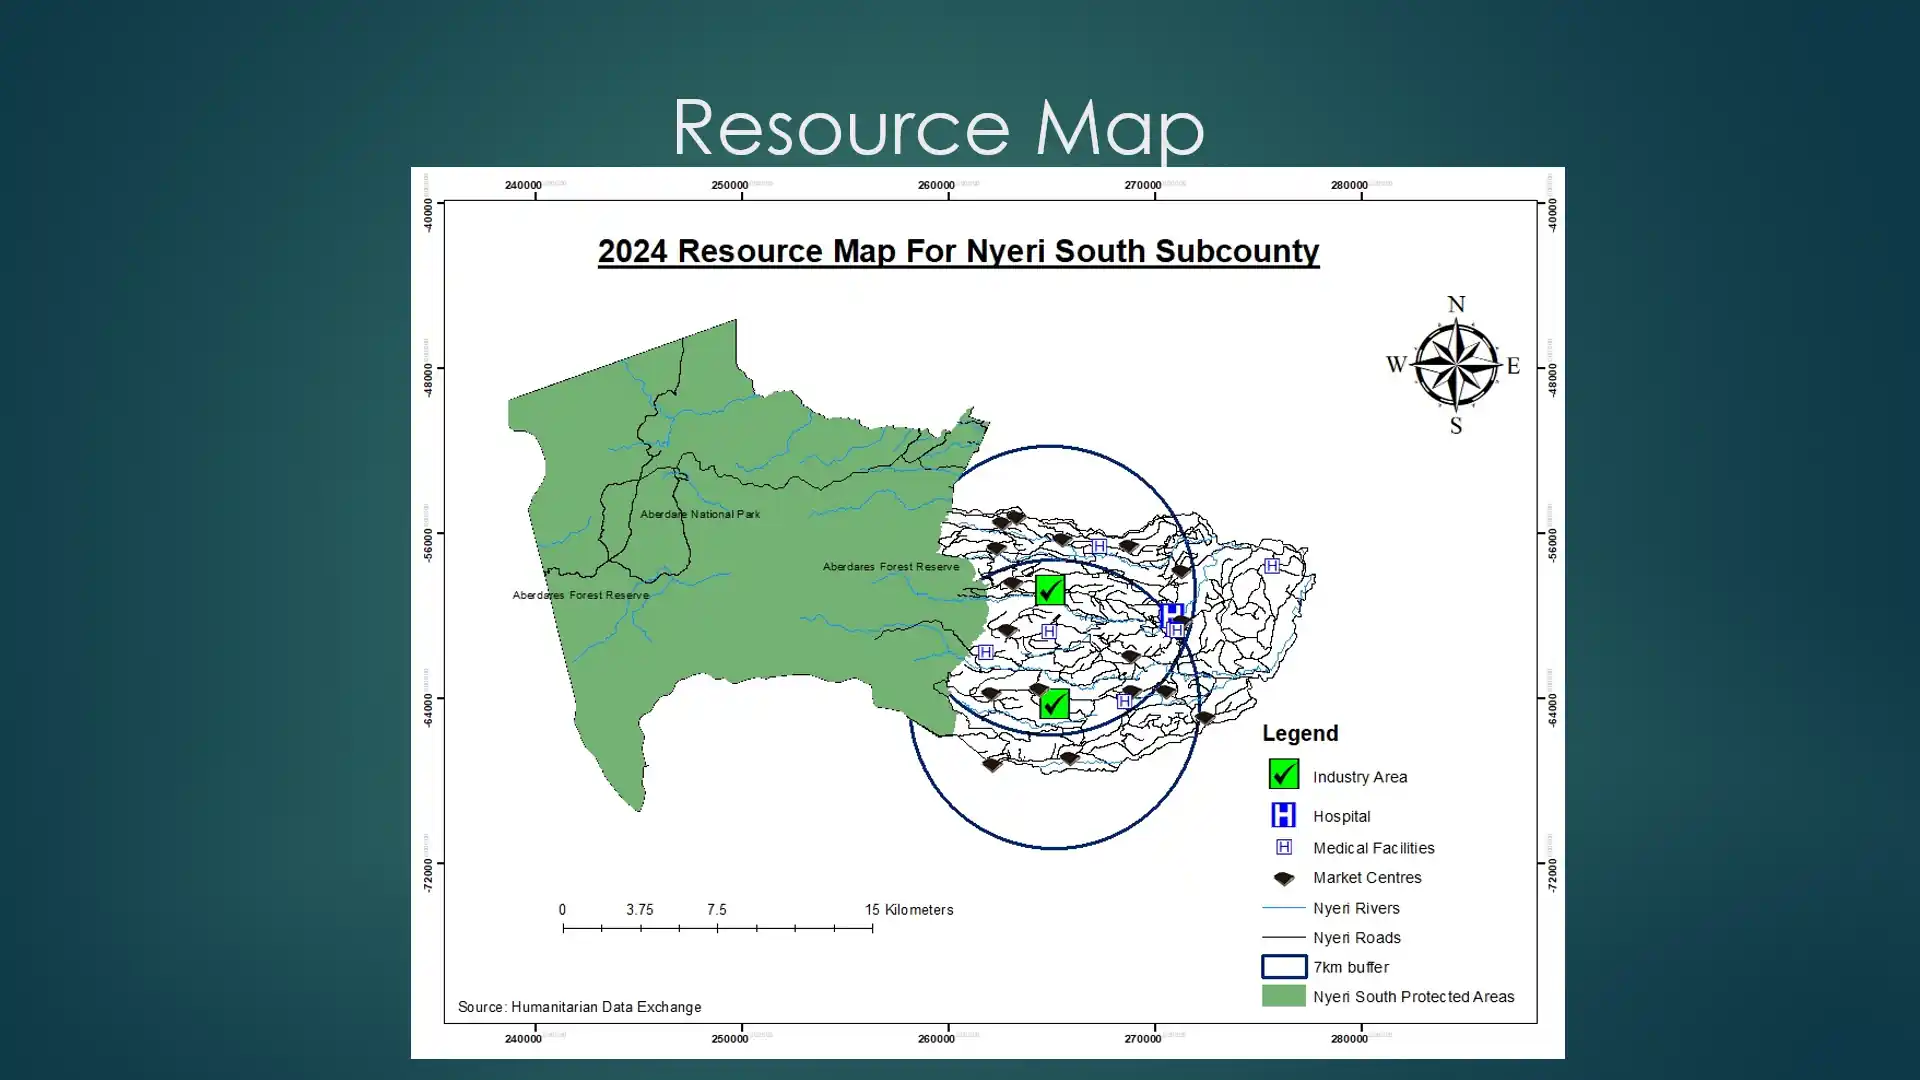
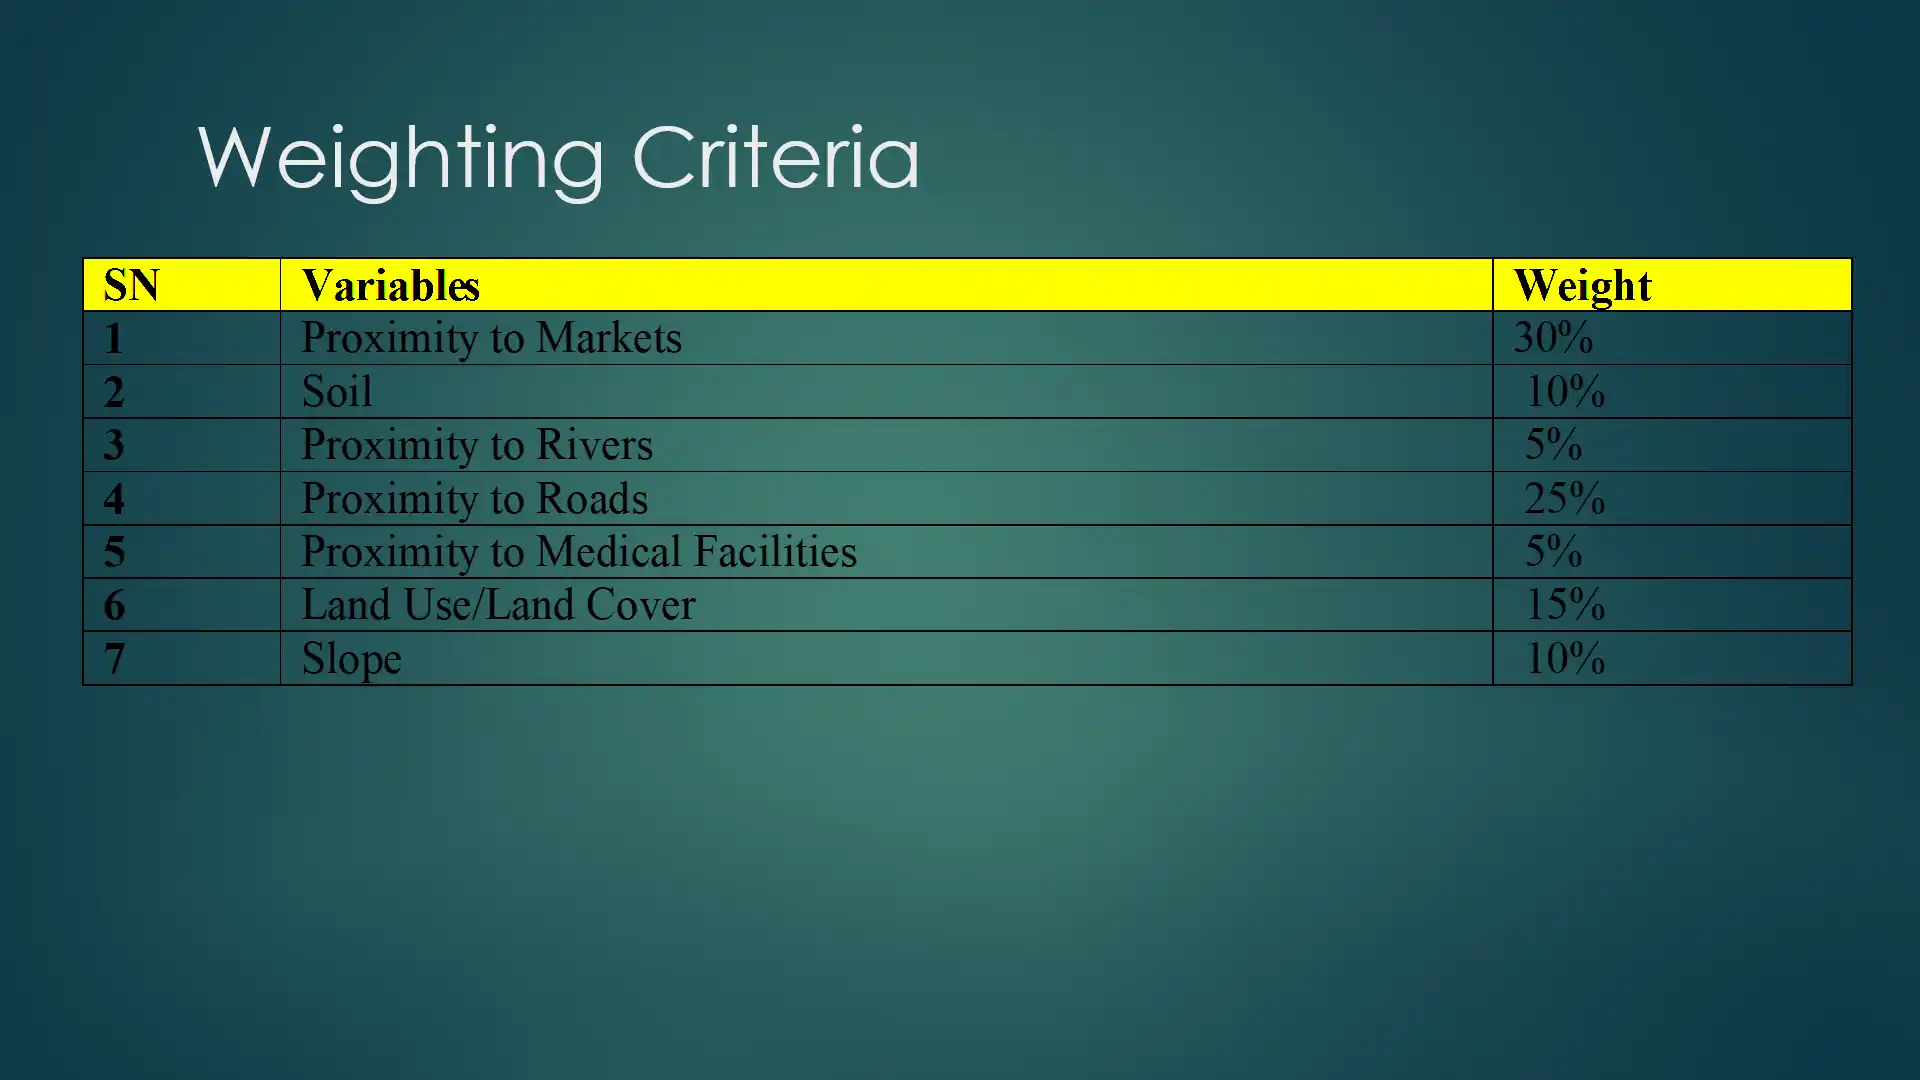
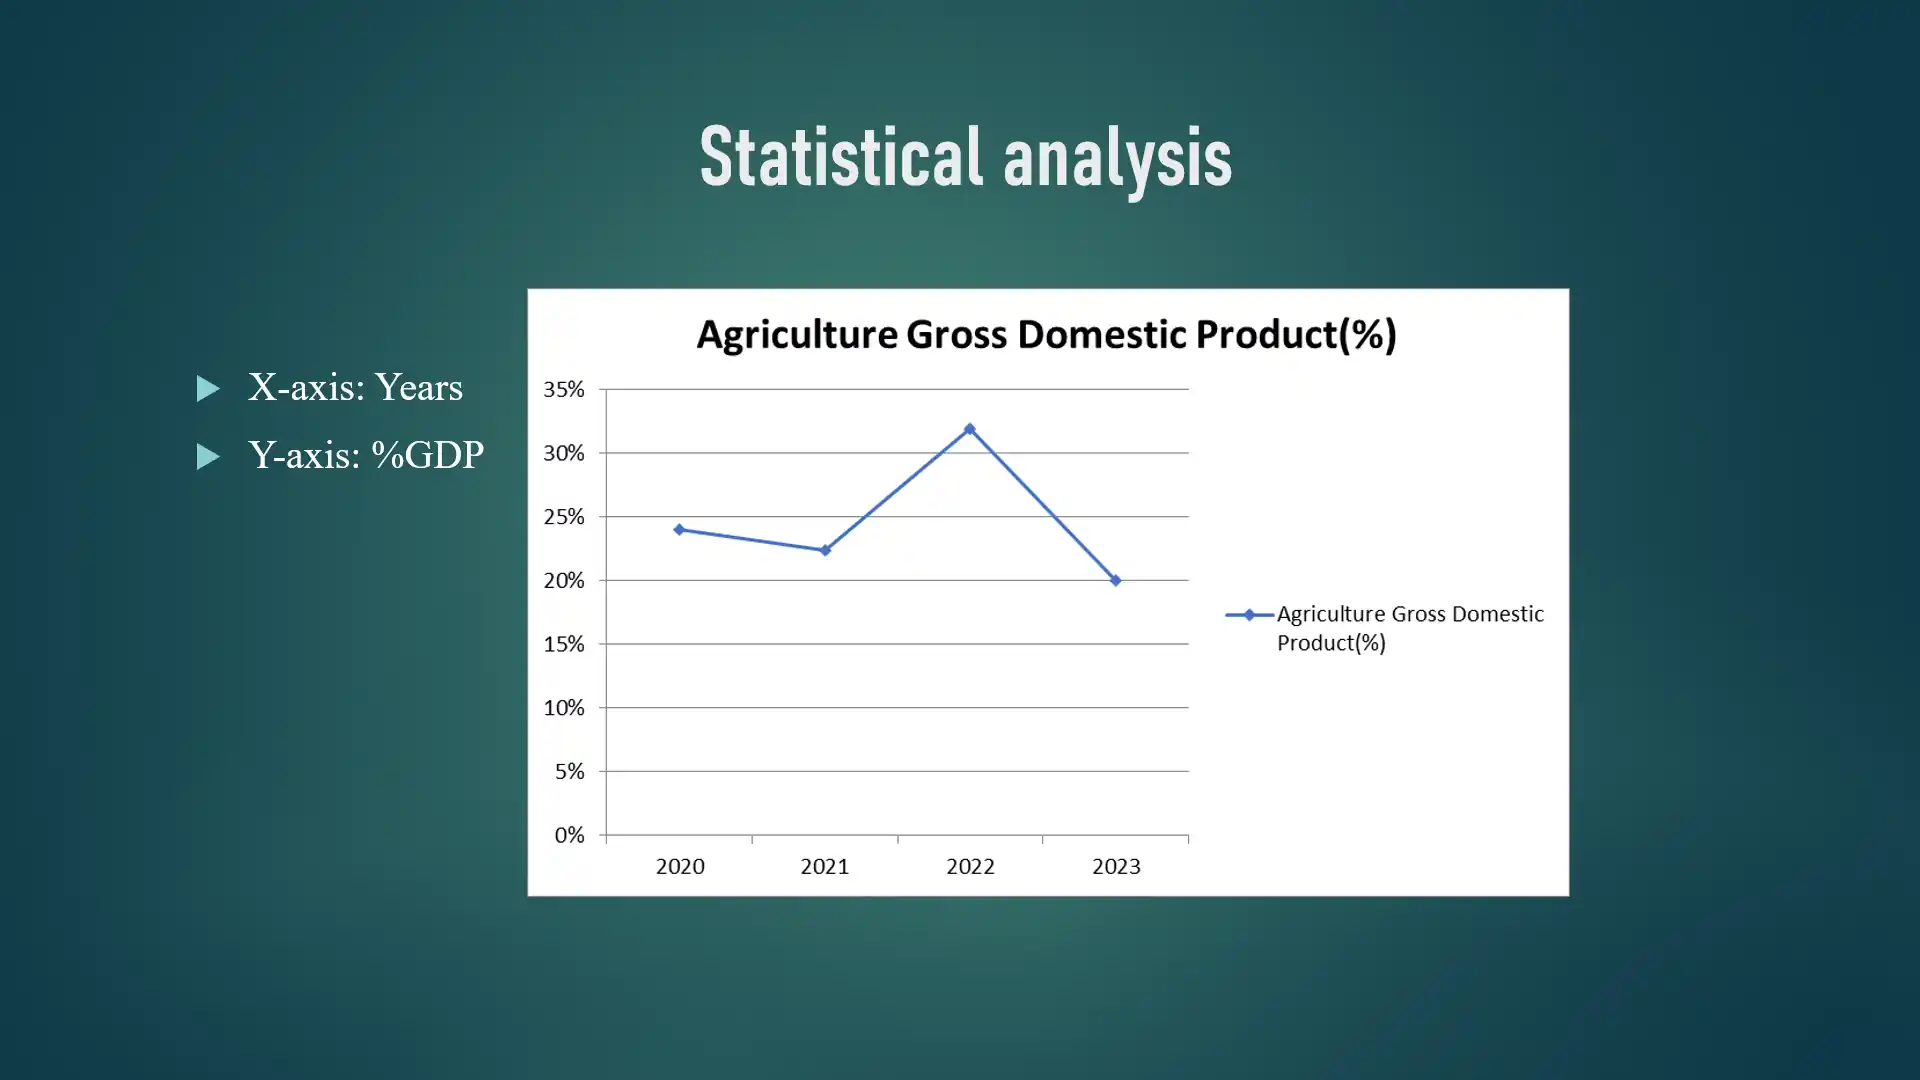
A featured project completed in 2024 at the Directorate of Resource Surveys and Remote Sensing (DRSRS), focusing on land use planning and site suitability analysis for industrial development in Nyeri County.








Mapping Expertise
- Spatial Analysis
- Cartography & Map Design
- Web Map Development
- Spatial Modelling
- Change Detection Analysis
- LiDAR Processing
- 3D Visualization
- Environmental Monitoring
- Spatial Risk Assessment
- Decision Support Systems